
Page 49 - Process simulation and control using Aspen
P. 49
42 PROCESS SIMULATION AND CONTROL USING ASPEN
5 T-xy and P-xy Diagrams of a Binary Mixture
1 . 3 .
Problem statement
A binary mixture , consisting of 60 mole% ethanol and 40 mole% water, is introduced
into a flash chamber (Flash2) with a flow rate of 120 kmol/hr at 3 bar and 250C
.
(a) Produce T-xy plot at a constant pressure (1.013 bar)
(b) Produce xy plot based on the data obtained in part (a)
(c) Produce P-xy plot at a constant temperature (90oC)
Use the Wilson activity coefficient model as a property method.
Simulation approach
As usual, start Aspen Plus and select Template. Click OK to get the next screen and
choose General with Metric Units. Then again hit OK. In the subsequent step, click OK
in the Connect to Engine window to obtain a blank Process Flowsheet Window.
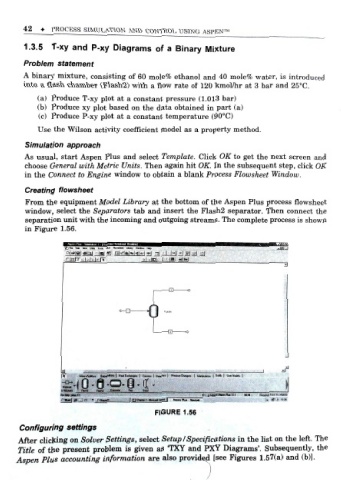
Creating flowsheet
From the equipment Model Library at the bottom of the Aspen Plus process flowsheet
window, select the Separators tab and insert the Flash2 separator. Then connect the
separation unit with the incoming and outgoing streams. The complete process is shown
in Figure 1.56.
1
- CD o
- 0 o
9-o
STfSAMS
FIGURE 1.56
Configuing settings
r
After clicking on Solver Settings, select Setup /Specifications in the list on the left. The
Title of the present problem is given as TXY and PXY Diagrams'. Subsequently, the
'
Aspen Plus accounting information are also provided [see Figures 1.57(a) and (b)].