Page 54 - Process simulation and control using Aspen
P. 54

INTRODUCTION AND STEPWISE ASPEN PLUS1 M SIMUL.\TION        47


               OltflBI lai Mel »l                        r3ii-|*i*i<H»!l 2  5J    Ji) M
                i  r-i-i-i>nr                                I  -"IBI  I' g 21!!
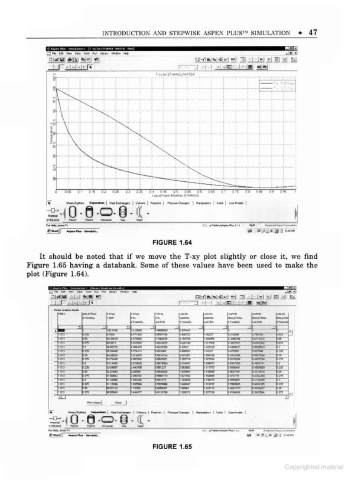


                                             FIGURE 1.64
            It should be noted that if we move the T-xy plot slightly or close it, we find
         Figure 1.65 having a databank. Some of these values have been used to make the
         plot (Figure 1.64).


                                                         n3K|fc!»|-qM!!H 3i
                                                        -
                                                         i  i  i  .i .m-  i  m\
                                              Mil*  I MMI
                                                    rwrrc


                                Wtfm
                                                            :  :  -


                    <o e-o-e-a;

                     «Mp»iM.i  lM«4Ml-
                                             FIGURE 1.65


                                                                                  Copyrighted material
   49   50   51   52   53   54   55   56   57   58   59