
Page 57 - Process simulation and control using Aspen
P. 57
50 PROCESS SIMULATION AND CONTROL USING AS PEN
Notice that the plot window can be edited b y right clicking on that window and
selecting Properties . In the properties window, the user can modify the title , axis scale
font , colour of the plot, etc. Alternatively, double-click on the different elements of the ,
plot and modify them as we like to improve the presentation and clarity.
SUMMARY AND CONCLUSIONS
In this chapter , a brief introduction of the Aspen simulator is presented first. It is well
recognized that the Aspen software is an extremely powerful simulation tool , in which
,
a large number of parameter values are stored in the databank and the calculations are
pre-programmed. At the preliminary stage of this software course, this chapter may
help to accustom with several items and stepwise simulation procedures. Here , four
simple problems (flash calculation, bubble point calculation, dew point calculation and
T -xy as well as P-xy plot generation) have been solved showing all simulation steps.
PROBLEMS |
1 .1 A liquid mixture, consisting of 60 mole% benzene and 40 mole% toluene, is fed
with a flow rate of 100 kmol/hr at 3 bar and 250C to a flash chamber (Flash2)
operated at 1.2 atm and 100 oC Applying the SYSOP0 method, compute the
.
amounts of liquid and vapour products and their compositions.
1 .2 A liquid mixture, consisting of 60 mole% benzene, 30 mole% toluene and
10 mole% o-xylene, is flashed at 1 atm and 110oC. The feed mixture with a flow
rate of 100 kmol/hr enters the flash drum (Flash2) at 1 atm and 80oC . Using the
SYSOP0 property method,
(a) Compute the amounts of liquid and vapour outlets and their compositions
(b) Repeat the calculation at 1.5 atm and 120oC (operating conditions)
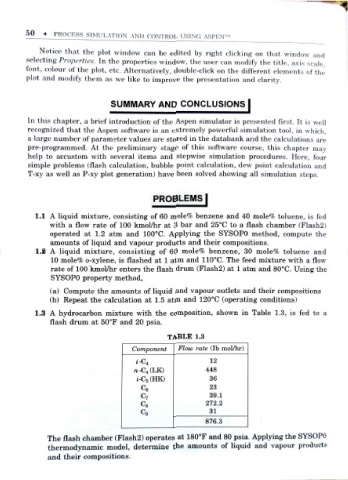
1 .3 A hydrocarbon mixture with the composition, shown in Table 1.3, is fed to a
flash drum at 50oF and 20 psia.
TABLE 1.3
Component Flow rate (lb moiyhr)
i-C 4 12
n-C 4(LK) 448
i-C 5(HK) 36
Ce 23
C7 39.1
272.2
c9 31
876.3
The flash chamber (Flash2) operates at 180 oF and 80 psia. Applying the SYSOP0
thermodynamic model, determine the amounts of liquid and vapour pro ducts
and their compositions.