
Page 53 - Process simulation and control using Aspen
P. 53
46 PROCESS SIMULATION AND CONTROL USING ASPEN
Q ru r« v«h> Ma TnA =.». itrvy wrdw h i
ni lMl -I U ini »ff)
j . i I 'I -IflPJ J - Jill mm
f fTIwioL
F3
J BSg I
nr [ iii.r-ini< iiiiuuTiJi I imii*mim I c * | n- .. | p.«m.o-«-. i m****-. i | u«.m~** i
P jT H il 3 s*»h
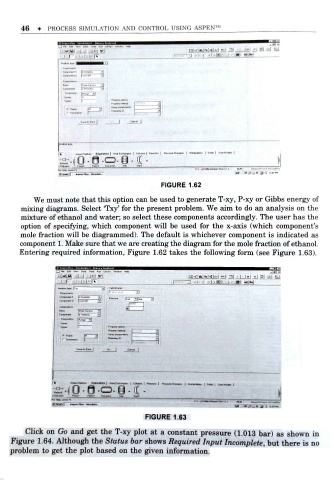
FIGURE 1.62
We must note that this option can be used to generate T-xy, P-xy or Gibbs energy of
mixing diagrams. Select Txy for the present problem. We aim to do an analysis on the
'
mixture of ethanol and water; so select these components accordingly. The user has the
'
option of specifying, which component will be used for the x-axis (which component s
mole fraction will be diagrammed). The default is whichever component is indicated as
component 1. Make sure that we are creating the diagram for the mole fraction of ethanol.
Entering required information , Figure 1.62 takes the following form (see Figure 1.63).
O lot* Pun lAf»y Wnion rteto
rsKlfel i Kl tj ! |n| jl! M
.-IJ l-M- r» 3
"
3
His-1
[WATER
lUj- "> ru.,
jEIKWDL
| l
MM >>«».l Vox x.- to..
FIGURE 1.63
Click on Go and get the T-xy plot at a constant pressure (1 .013 bar) as shown in
but there is no
Figure 1.64. Although the Status bar shows Required Input Incomplete ,
problem to get the plot based on the given information.