
Page 75 - Process simulation and control using Aspen
P. 75
68 PROCESS SIMULATION AND CONTROL USING ASPEN1 M
' Fie E« On TmH PU Lfrvy Wilder- *k>
0 Spiiccii
f
l li«< MBW
.
. jfl IM-SHi
O CuHslUnli Rovci ID
f
f
kfUCdRfMi
.11 -y-Bo
'
STREAMS RSioc RYwId REgnl RGMw RCSTl f RWjg REafch
O * $3 17 1'.
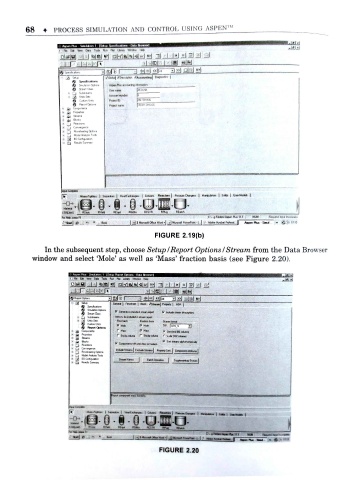
FIGURE 2.19(b)
In the subsequent step, choose Setup/Report Options / Stream from the Data Browser
window and select ' Mole' as well as 'Mass' fraction basis (see Figure 2.20).
B* E* Mxr CM* Todi ftr PW Uorv AWow h«b
i ajJJ iBJ J al-rlfeKKI I n>i ij J |h| a| 1 M
t
Cereal | Fowiho* | Bbcf Ali j Roperty j AW |
0 SkW* Qnl
tun U be ndmM r, tiiMm itpoii
r
. Jfl Ml S«t»
P MtJa P Mcta TFF [gENJ T]
! r Uau P Mm
|S Standard fa0cdm>i
P S.>- .:abh t
P Componerti t h (wo to-. 01 H -itDon
f " M- Sc*-.. | S».*n | HME
(Bill
StltW BV ffvuc RE.M- RGe. RCS1R RPI m j,
f
t
1 " -
FIGURE 2 .20