
Page 154 - Radar Technology Encyclopedia
P. 154
144 display, measurement display, plan-position indicator (PPI)
the scale to its length. To increase the accuracy of the mea-
surements, the scale is enlarged by reducing the area being O-display P-display
observed (see sector display). IAM
Ref.: Barton (1964), p. 7; Vasin (1977), p. 180.
A mosaic display is a complex display of a radar detection Signal intensity
system that combines data from several nonsynchronized
radar sets, each of which detects targets within an adjacent Range
area. The mosaic display is based on the use of the principle Marker notch
of sweep conversion, which enables the operator to select any Range Azimuth
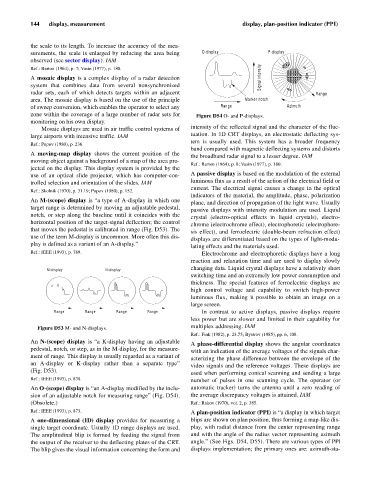
zone within the coverage of a large number of radar sets for Figure D54 O- and P-displays.
monitoring on his own display.
Mosaic displays are used in air traffic control systems of intensity of the reflected signal and the character of the fluc-
large airports with intensive traffic. IAM tuation. In 1D CRT displays, an electrostatic deflecting sys-
tem is usually used. This system has a broader frequency
Ref.: Popov (1980), p. 236.
band compared with magnetic deflecting systems and distorts
A moving-map display shows the current position of the the broadband radar signal to a lesser degree. IAM
moving object against a background of a map of the area pro-
Ref.: Barton (1964), p. 8; Vasin (1977), p. 180.
jected on the display. This display system is provided by the
use of an optical slide projector, which has computer-con- A passive display is based on the modulation of the external
trolled selection and orientation of the slides. IAM luminous flux as a result of the action of the electrical field or
current. The electrical signal causes a change in the optical
Ref.: Skolnik (1970), p. 31.19; Popov (1980), p. 152.
indicators of the material, the amplitude, phase, polarization
An M-(scope) display is “a type of A-display in which one plane, and direction of propagation of the light wave. Usually
target range is determined by moving an adjustable pedestal, passive displays with intensity modulation are used. Liquid
notch, or step along the baseline until it coincides with the crystal (electro-optical effects in liquid crystals), electro-
horizontal position of the target-signal deflection; the control chrome (electrochrome effect), electrophoretic (electrophore-
that moves the pedestal is calibrated in range (Fig. D53). The sis effect), and ferroelectric (double-beam refraction effect)
use of the term M-display is uncommon. More often this dis- displays are differentiated based on the types of light-modu-
play is defined as a variant of an A-display.” lating effects and the materials used.
Ref.: IEEE (1993), p. 789. Electrochrome and electrophoretic displays have a long
reaction and relaxation time and are used to display slowly
changing data. Liquid crystal displays have a relatively short
M-display N-display
switching time and an extremely low power consumption and
thickness. The special features of ferroelectric displays are
high control voltage and capability to switch high-power
luminous flux, making it possible to obtain an image on a
large screen.
Range Range Range Range In contrast to active displays, passive displays require
less power but are slower and limited in their capability for
Figure D53 M- and N-displays. multiplex addressing. IAM
Ref.: Fink (1982), p. 23.75; Bystrov (1985), pp. 6, 108.
An N-(scope) display is “a K-display having an adjustable A phase-differential display shows the angular coordinates
pedestal, notch, or step, as in the M-display, for the measure- with an indication of the average voltages of the signals char-
ment of range. This display is usually regarded as a variant of acterizing the phase difference between the envelope of the
an A-display or K-display rather than a separate type” video signals and the reference voltages. These displays are
(Fig. D53). used when performing conical scanning and sending a large
Ref.: IEEE (1993), p. 838. number of pulses in one scanning cycle. The operator (or
An O-(scope) display is “an A-display modified by the inclu- automatic tracker) turns the antenna until a zero reading of
sion of an adjustable notch for measuring range” (Fig. D54). the average discrepancy voltages is attained. IAM
(Obsolete.) Ref.: Rakov (1970), vol. 2, p. 385.
Ref.: IEEE (1993), p. 873. A plan-position indicator (PPI) is “a display in which target
A one-dimensional (1D) display provides for measuring a blips are shown on plan position, thus forming a map-like dis-
single target coordinate. Usually 1D range displays are used. play, with radial distance from the center representing range
The amplitudinal blip is formed by feeding the signal from and with the angle of the radius vector representing azimuth
the output of the receiver to the deflecting plates of the CRT. angle.” (See Figs. D54, D55). There are various types of PPI
The blip gives the visual information concerning the form and displays implementation; the primary ones are: azimuth-sta-