
Page 25 - Radiochemistry and nuclear chemistry
P. 25
14 Radiochemistry and Nuclear Chemistry
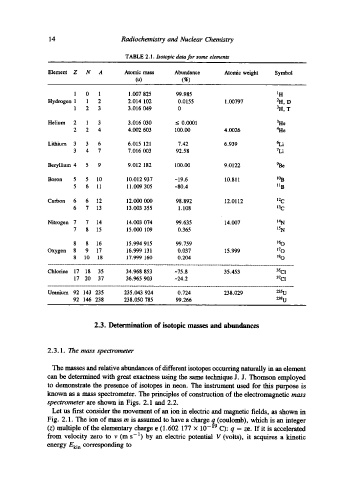
TABLE 2.1. Isotopic data for some elements
Element Z N A Atomic mass Abundance Atomic weight Symbol
(u) (~)
1 0 1 1.007 825 99.985 1 H
Hydrogen 1 1 2 2.014 102 0.0155 1.00797 2H, D
1 2 3 3.016 049 0 3H, T
Helium 2 1 3 3.016 030 __ 0.0001 3He
2 2 4 4.002 603 100.00 4.0026 4He
Lithium 3 3 6 6.015 121 7.42 6.939 6Li
3 4 7 7.016 003 92.58 7Li
Beryllium 4 5 9 9.012 182 100.00 9.0122 ~e
Boron 5 5 10 10.012 937 -19.6 10.811 l%
5 6 11 11.009 305 -80.4 II B
Carbon 6 6 12 12.000 000 98.892 12.0112 12 c
6 7 13 13.003 355 1.108 13 C
Nitrogen 7 7 14 14.003 074 99.635 14.007 14 N
7 8 15 15.000 109 0.365 15 N
8 8 16 15.994 915 99.759 16 o
Oxygen 8 9 17 16.999 131 0.037 15.999 t70
8 10 18 17.999 160 0.204 18 O
Chlorine 17 18 35 34.968 853 -75.8 35.453 35C1
17 20 37 36.965 903 -24.2 37C1
Uranium 92 143 235 235.043 924 0.724 238.029 235 U
92 146 238 238.050 785 99.266 238 U
2.3. Determination of isotopic masses and abundances
2.3.1. The mass spectrometer
The masses and relative abundances of different isotopes occurring naturally in an dement
can be determined with great exactness using the same technique J. J. Thomson employed
to demonstrate the presence of isotopes in neon. The instrument used for this purpose is
known as a mass spectrometer. The principles of construction of the electromagnetic mass
spectrometer are shown in Figs. 2.1 and 2.2.
Let us first consider the movement of an ion in electric and magnetic fields, as shown in
Fig. 2.1. The ion of mass m is assumed to have a charge q (coulomb), which is an integer
(z) multiple of the elementary charge e (1.602 177 x 10 -i9 C): q = ze. If it is accelerated
from velocity zero to v (m s -1) by an electric potential V (volts), it acquires a kinetic
energy Ela n corresponding to