
Page 132 - Rapid Learning in Robotics
P. 132
118 Application Examples in the Robotics Domain
160
Mean Cartesian Deviation [mm]
140 Mean Joint Angle Deviation [deg]
120
100
80
60
40
20
0
0 100 200 300 400 500 600 700 800
Number of Training Examples
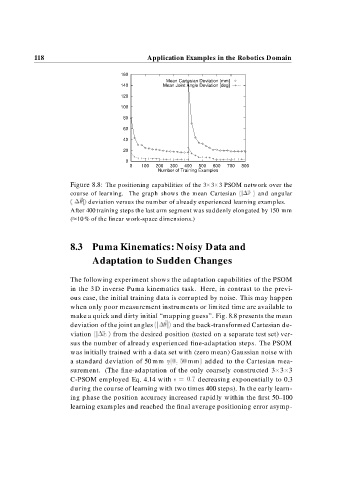
Figure 8.8: The positioning capabilities of the 3 3 3 PSOM network over the
course of learning. The graph shows the mean Cartesian hj rji and angular
hj ji deviation versus the number of already experienced learning examples.
After 400 training steps the last arm segment was suddenly elongated by 150 mm
( 10 % of the linear work-space dimensions.)
8.3 Puma Kinematics: Noisy Data and
Adaptation to Sudden Changes
The following experiment shows the adaptation capabilities of the PSOM
in the 3 D inverse Puma kinematics task. Here, in contrast to the previ-
ous case, the initial training data is corrupted by noise. This may happen
when only poor measurement instruments or limited time are available to
make a quick and dirty initial “mapping guess”. Fig. 8.8 presents the mean
deviation of the joint angles hj ji and the back-transformed Cartesian de-
viation hj rji from the desired position (tested on a separate test set) ver-
sus the number of already experienced fine-adaptation steps. The PSOM
was initially trained with a data set with (zero mean) Gaussian noise with
a standard deviation of 50 mm mm added to the Cartesian mea-
surement. (The fine-adaptation of the only coarsely constructed 3 3 3
C-PSOM employed Eq. 4.14 with decreasing exponentially to 0.3
during the course of learning with two times 400 steps). In the early learn-
ing phase the position accuracy increased rapidly within the first 50–100
learning examples and reached the final average positioning error asymp-