
Page 149 - Rapid Learning in Robotics
P. 149
9.3 Examples 135
x u
u x F T P S x O u ref (9.2)
M
u
a ref
u ref F M
P e t S u O M M e t a (9.3)
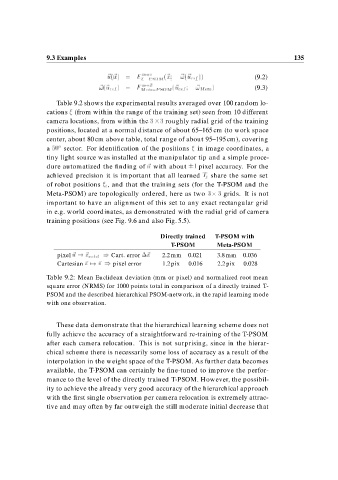
Table 9.2 shows the experimental results averaged over 100 random lo-
cations (from within the range of the training set) seen from 10 different
camera locations, from within the roughly radial grid of the training
positions, located at a normal distance of about 65–165 cm (to work space
center, about 80 cm above table, total range of about 95–195cm), covering
a sector. For identification of the positions in image coordinates, a
tiny light source was installed at the manipulator tip and a simple proce-
dure automatized the finding of u with about pixel accuracy. For the
achieved precision it is important that all learned T j share the same set
of robot positions i , and that the training sets (for the T-PSOM and the
Meta-PSOM) are topologically ordered, here as two grids. It is not
important to have an alignment of this set to any exact rectangular grid
in e.g. world coordinates, as demonstrated with the radial grid of camera
training positions (see Fig. 9.6 and also Fig. 5.5).
Directly trained T-PSOM with
T-PSOM Meta-PSOM
pixel u
x robot Cart. error x 2.2 mm 0.021 3.8 mm 0.036
Cartesian x
u pixel error 1.2 pix 0.016 2.2 pix 0.028
Table 9.2: Mean Euclidean deviation (mm or pixel) and normalized root mean
square error (NRMS) for 1000 points total in comparison of a directly trained T-
PSOM and the described hierarchical PSOM-network, in the rapid learning mode
with one observation.
These data demonstrate that the hierarchical learning scheme does not
fully achieve the accuracy of a straightforward re-training of the T-PSOM
after each camera relocation. This is not surprising, since in the hierar-
chical scheme there is necessarily some loss of accuracy as a result of the
interpolation in the weight space of the T-PSOM. As further data becomes
available, the T-PSOM can certainly be fine-tuned to improve the perfor-
mance to the level of the directly trained T-PSOM. However, the possibil-
ity to achieve the already very good accuracy of the hierarchical approach
with the first single observation per camera relocation is extremely attrac-
tive and may often by far outweigh the still moderate initial decrease that