
Page 81 - Rapid Learning in Robotics
P. 81
5.2 Map Learning with Unregularly Sampled Training Points 67
a) b) c) d)
e) f) g) h)
+ =
d
c
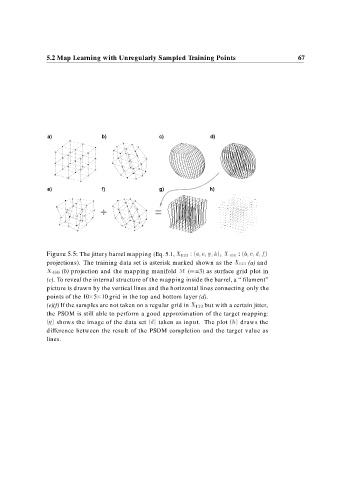
Figure 5.5: The jittery barrel mapping (Eq. 5.1, X a e gh b Xf
projections). The training data set is asterisk marked shown as the X (a) and
X (b) projection and the mapping manifold M (m=3) as surface grid plot in
(c). To reveal the internal structure of the mapping inside the barrel, a “ filament”
picture is drawn by the vertical lines and the horizontal lines connecting only the
points of the 10 5 10 grid in the top and bottom layer (d).
(e)(f) If the samples are not taken on a regular grid in X but with a certain jitter,
the PSOM is still able to perform a good approximation of the target mapping:
g shows the image of the data set d taken as input. The plot h draws the
difference between the result of the PSOM completion and the target value as
lines.