
Page 307 - Refining Biomass Residues for Sustainable Energy and Bioproducts
P. 307
276 Refining Biomass Residues for Sustainable Energy and Bioproducts
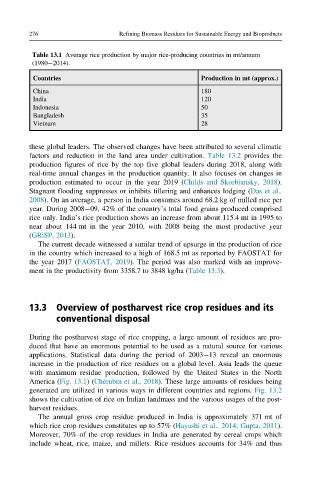
Table 13.1 Average rice production by major rice-producing countries in mt/annum
(1980 2014).
Countries Production in mt (approx.)
China 180
India 120
Indonesia 50
Bangladesh 35
Vietnam 28
these global leaders. The observed changes have been attributed to several climatic
factors and reduction in the land area under cultivation. Table 13.2 provides the
production figures of rice by the top five global leaders during 2018, along with
real-time annual changes in the production quantity. It also focuses on changes in
production estimated to occur in the year 2019 (Childs and Skorbiansky, 2018).
Stagnant flooding suppresses or inhibits tillering and enhances lodging (Das et al.,
2008). On an average, a person in India consumes around 68.2 kg of milled rice per
year. During 2008 09, 42% of the country’s total food grains produced comprised
rice only. India’s rice production shows an increase from about 115.4 mt in 1995 to
near about 144 mt in the year 2010, with 2008 being the most productive year
(GRiSP, 2013).
The current decade witnessed a similar trend of upsurge in the production of rice
in the country which increased to a high of 168.5 mt as reported by FAOSTAT for
the year 2017 (FAOSTAT, 2019). The period was also marked with an improve-
ment in the productivity from 3358.7 to 3848 kg/ha (Table 13.3).
13.3 Overview of postharvest rice crop residues and its
conventional disposal
During the postharvest stage of rice cropping, a large amount of residues are pro-
duced that have an enormous potential to be used as a natural source for various
applications. Statistical data during the period of 2003 13 reveal an enormous
increase in the production of rice residues on a global level. Asia leads the queue
with maximum residue production, followed by the United States in the North
America (Fig. 13.1)(Cherubin et al., 2018). These large amounts of residues being
generated are utilized in various ways in different countries and regions. Fig. 13.2
shows the cultivation of rice on Indian landmass and the various usages of the post-
harvest residues.
The annual gross crop residue produced in India is approximately 371 mt of
which rice crop residues constitutes up to 57% (Hayashi et al., 2014; Gupta, 2011).
Moreover, 70% of the crop residues in India are generated by cereal crops which
include wheat, rice, maize, and millets. Rice residues accounts for 34% and thus