
Page 308 - Refining Biomass Residues for Sustainable Energy and Bioproducts
P. 308
Potentials of postharvest rice crop residues as a source of biofuel 277
Table 13.2 Production statistics of top five global rice producers for the year 2018 and
estimates for the year 2019.
Countries Production in mt Annual Projected annual changes for
(approx.) changes in mt the year 2019 in mt
China 145.98 1.03 2 5.18 a
India 110.00 3.21 2 2.91 a
Indonesia 37.00 0.14 0.30
Bangladesh 32.65 2 1.92 a 1.75
Vietnam 28.94 1.54 0.12
a
Indicates a decline in the production as compared to the previous year.
Source: USDA, Foreign Agricultural Service. Production, Supply, & Distribution Online Data Base. USDA, Foreign
Agricultural Service. ,https://www.fas.usda.gov/psdonline/psdHome.aspx. (last updated 10.09.18).
Table 13.3 Information on rice production in India (2010 17).
Year Harvested area (ha) Yield (kg/ha) Production (mt)
2010 42,862,400 3358.7 143.9
2011 44,010,000 3587.8 157.9
2012 42,754,000 3690.9 157.8
2013 44,135,950 3607.0 159.2
2014 44,110,000 3563.8 157.2
2015 43,390,000 3607.7 156.5
2016 43,190,000 3790.2 163.7
2017 43,789,000 3848.0 168.5
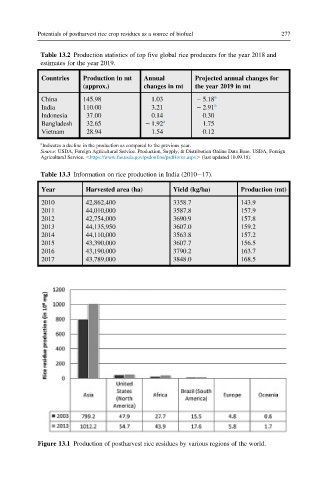
Figure 13.1 Production of postharvest rice residues by various regions of the world.