
Page 398 - Refining Biomass Residues for Sustainable Energy and Bioproducts
P. 398
Agroindustry wastes: biofuels and biomaterials feedstocks for sustainable rural development 361
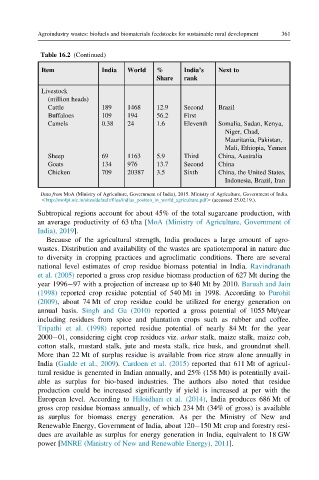
Table 16.2 (Continued)
Item India World % India’s Next to
Share rank
Livestock
(million heads)
Cattle 189 1468 12.9 Second Brazil
Buffaloes 109 194 56.2 First
Camels 0.38 24 1.6 Eleventh Somalia, Sudan, Kenya,
Niger, Chad,
Mauritania, Pakistan,
Mali, Ethiopia, Yemen
Sheep 69 1163 5.9 Third China, Australia
Goats 134 976 13.7 Second China
Chicken 709 20387 3.5 Sixth China, the United States,
Indonesia, Brazil, Iran
Data from MoA (Ministry of Agriculture, Government of India), 2015. Ministry of Agriculture, Government of India.
,http://mofpi.nic.in/sites/default/files/indias_positon_in_world_agriculture.pdf. (accessed 25.02.19.).
Subtropical regions account for about 45% of the total sugarcane production, with
an average productivity of 63 t/ha [MoA (Ministry of Agriculture, Government of
India), 2019].
Because of the agricultural strength, India produces a large amount of agro-
wastes. Distribution and availability of the wastes are spatiotemporal in nature due
to diversity in cropping practices and agroclimatic conditions. There are several
national level estimates of crop residue biomass potential in India. Ravindranath
et al. (2005) reported a gross crop residue biomass production of 627 Mt during the
year 1996 97 with a projection of increase up to 840 Mt by 2010. Baruah and Jain
(1998) reported crop residue potential of 540 Mt in 1998. According to Purohit
(2009), about 74 Mt of crop residue could be utilized for energy generation on
annual basis. Singh and Gu (2010) reported a gross potential of 1055 Mt/year
including residues from spice and plantation crops such as rubber and coffee.
Tripathi et al. (1998) reported residue potential of nearly 84 Mt for the year
2000 01, considering eight crop residues viz. arhar stalk, maize stalk, maize cob,
cotton stalk, mustard stalk, jute and mesta stalk, rice husk, and groundnut shell.
More than 22 Mt of surplus residue is available from rice straw alone annually in
India (Gadde et al., 2009). Cardoen et al. (2015) reported that 611 Mt of agricul-
tural residue is generated in Indian annually, and 25% (158 Mt) is potentially avail-
able as surplus for bio-based industries. The authors also noted that residue
production could be increased significantly if yield is increased at per with the
European level. According to Hiloidhari et al. (2014), India produces 686 Mt of
gross crop residue biomass annually, of which 234 Mt (34% of gross) is available
as surplus for biomass energy generation. As per the Ministry of New and
Renewable Energy, Government of India, about 120 150 Mt crop and forestry resi-
dues are available as surplus for energy generation in India, equivalent to 18 GW
power [MNRE (Ministry of New and Renewable Energy), 2011].