
Page 184 - Reliability and Maintainability of In service Pipelines
P. 184
168 Reliability and Maintainability of In-Service Pipelines
1 0.9 1
Probability of failure 0.7 k = 0.58 Probability of failure 0.7 J = 0.22
0.9
0.8
0.8
0.6
0.6
0.5
0.5
J = 0.30
0.4
k = 0.90
0.4
0.3
0.3
k = 1.22
J = 0.38
0.2
0.1
0.1
0 0.2 0
0 25 50 75 100 125 150 175 200 0 25 50 75 100 125 150 175 200
Time (year) Time (year)
(a) (b)
1
1
0.9 0.9
Probability of failure 0.6 [DS] = 1 mg/L Probability of failure 0.6 u = 0.46 m/s
0.8
0.8
0.7
0.7
0.5
0.5
u = 0.70 m/s
0.4
0.4
0.3
u = 0.94 m/s
0.3
0.2
0.2
[DS] =2 mg/L
0.1
0.1
0
[DS] = 3 mg/L
0
0 25 50 75 100 125 150 175 200
0 25 50 75 100 125 150 175 200
Time (year)
Time (year)
(c) (d)
1 0.9 1
0.9
Probability of failure 0.7 b/P' = 0.43 Probability of failure 0.7 A = 0.15
0.8
0.8
0.6
0.6
0.5
0.5
0.4
0.4
A = 0.22
b/P' = 0.71
0.3
0.3
0.2
0.1
0.1
0 b/P' = 0.99 0.2 A = 0.29
0
0 25 50 75 100 125150 175200
0 25 50 75 100 125 150 175 200
Time (year) Time (year)
(e) (f)
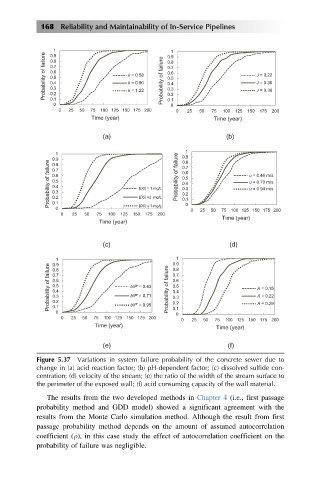
Figure 5.37 Variations in system failure probability of the concrete sewer due to
change in (a) acid reaction factor; (b) pH-dependent factor; (c) dissolved sulfide con-
centration; (d) velocity of the stream; (e) the ratio of the width of the stream surface to
the perimeter of the exposed wall; (f) acid consuming capacity of the wall material.
The results from the two developed methods in Chapter 4 (i.e., first passage
probability method and GDD model) showed a significant agreement with the
results from the Monte Carlo simulation method. Although the result from first
passage probability method depends on the amount of assumed autocorrelation
coefficient (ρ), in this case study the effect of autocorrelation coefficient on the
probability of failure was negligible.