
Page 181 - Reliability and Maintainability of In service Pipelines
P. 181
Case Studies on the Application of Structural Reliability 165
th
ðtÞ is the probability of failure due to the i failure mode of pipe and m
where P f i
is the number of failure modes considered in the system.
Considering the system configuration presented in Fig. 5.33 and the upper
bound of Eq. (3.7), the probability of failure of the whole concrete sewer system
can be calculated by the following equation:
ð5:34Þ
P fs tðÞ 5 1 2 1 2 P f 1 1 2 P f 2 : 12P f 3 :P f 4
where:
is the probability of flexural failure;
P f 1
is the probability of shear failure;
P f 2
is the probability of crack failure;
P f 3
is the probability of cover loss failure.
P f 4
For reliability analysis of the sewer, initially, the probability of failure in time
ðtÞ,i 5 1,..,4) is estimated by using one of the two pro-
t for each failure mode (P f i
posed methods (first passage probability and/or GDD model). Then Eq. (5.34) is
used for calculation of the probability of the sewer system failure (P f t ðÞÞ, consid-
ering all four possible failure modes.
5.4.4.1 Results and Analysis
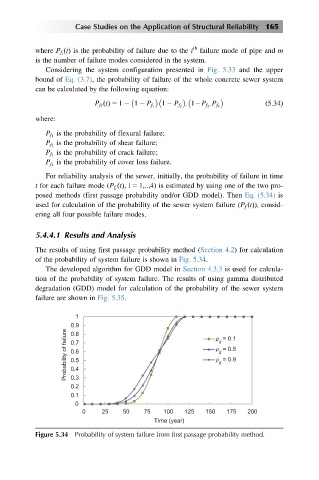
The results of using first passage probability method (Section 4.2) for calculation
of the probability of system failure is shown in Fig. 5.34.
The developed algorithm for GDD model in Section 4.3.3 is used for calcula-
tion of the probability of system failure. The results of using gamma distributed
degradation (GDD) model for calculation of the probability of the sewer system
failure are shown in Fig. 5.35.
1
0.9 ρ = 0.1
Probability of failure 0.7 ρ = 0.5
0.8
d
0.6
d
ρ = 0.9
0.5
d
0.4
0.3
0.2
0.1
0
0 25 50 75 100 125 150 175 200
Time (year)
Figure 5.34 Probability of system failure from first passage probability method.