
Page 182 - Reliability and Maintainability of In service Pipelines
P. 182
166 Reliability and Maintainability of In-Service Pipelines
1
0.9
0.8
Probability of failure 0.6
0.7
0.5
0.4
0.3
0.2
0.1
0
0 25 50 75 100 125 150 175 200
Time (year)
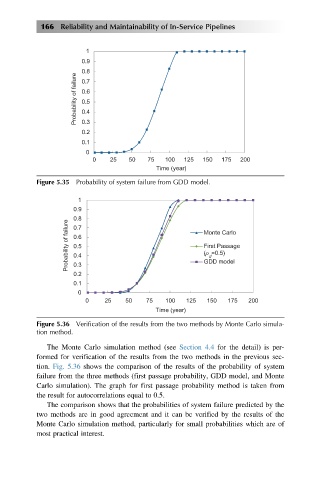
Figure 5.35 Probability of system failure from GDD model.
1
0.9
0.8
Probability of failure 0.6 Monte Carlo
0.7
First Passage
0.5
(ρ =0.5)
0.4
d
0.3
0.2 GDD model
0.1
0
0 25 50 75 100 125 150 175 200
Time (year)
Figure 5.36 Verification of the results from the two methods by Monte Carlo simula-
tion method.
The Monte Carlo simulation method (see Section 4.4 for the detail) is per-
formed for verification of the results from the two methods in the previous sec-
tion. Fig. 5.36 shows the comparison of the results of the probability of system
failure from the three methods (first passage probability, GDD model, and Monte
Carlo simulation). The graph for first passage probability method is taken from
the result for autocorrelations equal to 0.5.
The comparison shows that the probabilities of system failure predicted by the
two methods are in good agreement and it can be verified by the results of the
Monte Carlo simulation method, particularly for small probabilities which are of
most practical interest.