Page 134 - Renewable Energy Devices and System with Simulations in MATLAB and ANSYS
P. 134

Overview of PV Maximum Power Point Tracking Techniques                      121


                                      Ideal PV array voltage  PV array series resistance
              Discrete,                   v  +         +
              Ts= 0.1 s.                    –     +
                                                     Controlled current
              Powergui    Open-circuit voltage (V)  – source (ideal PV array)
                               57        Vd       s
                                         Voc
                        6      + +   + +  Isc                    + i  – PV array output current
                                         Ns    Id
                  Short-circuit current (A)  Tc  PV
                                         n
             1st step change of the short-circuit current (A)  Ideal PV array
                                           model
                                                                           +  Controlled voltage source
             2nd step change of the short-circuit current (A)  DC/DC converter  Buck converter model  (Buck converter
                                              +   output voltage (V)  V o  s  –  with output voltage V )
                                                                                         o
                              90               v                      Vpv
                                              –       12      DC Converter
                       Number of solar cells in series  PV array
                              45             output
                        Solar cell temperature (°C)  voltage                 ×        Scope
                              1                      1       V o        PV array output power
                                                             Ipv
                        Ideality factor of solar cells  Delays  Vpv  DC    calculation
                                                  Tapped Delay 1  delta MPPT
                                                             V oc
                                                     1        P&O MPPT
                                                    Delays     algorithm
                                                  Tapped Delay 2
                                                    0.001
                                                Perturbation step (0-1)
            FIGURE 5.21  A MATLAB /Simulink  model of the P&O MPPT process applied to a buck-type DC/DC
                                  ®
                                          ®
            converter with a constant output voltage.
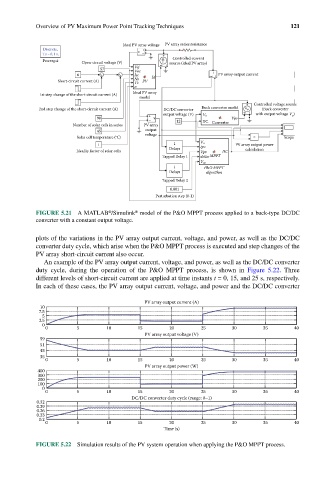
            plots of the variations in the PV array output current, voltage, and power, as well as the DC/DC
            converter duty cycle, which arise when the P&O MPPT process is executed and step changes of the
            PV array short-circuit current also occur.
              An example of the PV array output current, voltage, and power, as well as the DC/DC  converter
            duty cycle, during the operation of the P&O MPPT process, is shown in  Figure 5.22. Three
              different levels of short-circuit current are applied at time instants t = 0, 15, and 25 s, respectively.
            In each of these cases, the PV array output current, voltage, and power and the DC/DC converter

                                            PV array output current (A)
             10
             7.5
              5
             2.5
              0
               0        5        10       15        20       25        30       35       40
                                            PV array output voltage (V)
             59
             51
             43
             35
               0        5        10       15        20       25        30       35       40
                                             PV array output power (W)
            400
            300
            200
            100
              0
               0        5        10       15        20       25        30       35       40
                                         DC/DC converter duty cycle (range: 0–1)
            0.32
            0.29
            0.26
            0.23
             0.2
               0        5        10       15        20       25        30       35       40
                                                  Time (s)
            FIGURE 5.22  Simulation results of the PV system operation when applying the P&O MPPT process.
   129   130   131   132   133   134   135   136   137   138   139