
Page 177 - Renewable Energy Devices and System with Simulations in MATLAB and ANSYS
P. 177
164 Renewable Energy Devices and Systems with Simulations in MATLAB and ANSYS ®
®
P turb
(W)
P lim
Power
level
lron loss
P max
Copper loss
V min V max v (m/s)
FIGURE 7.8 Copper and iron losses with power level versus wind velocity.
P turb
(W)
P lim Power
Energy- Loss
captured level level
area
P max
V min V max v (m/s)
FIGURE 7.9 Energy-captured area for a large operating range.
P turb
(W)
P lim
Energy-captured Power
area level Loss
P max level
V min V max v (m/s)
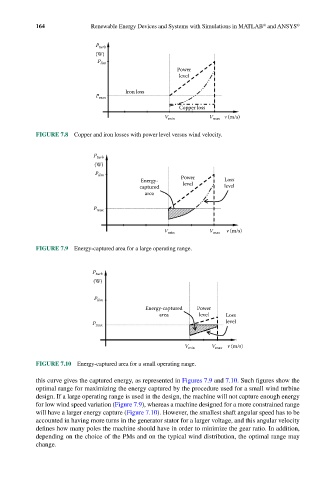
FIGURE 7.10 Energy-captured area for a small operating range.
this curve gives the captured energy, as represented in Figures 7.9 and 7.10. Such figures show the
optimal range for maximizing the energy captured by the procedure used for a small wind turbine
design. If a large operating range is used in the design, the machine will not capture enough energy
for low wind speed variation (Figure 7.9), whereas a machine designed for a more constrained range
will have a larger energy capture (Figure 7.10). However, the smallest shaft angular speed has to be
accounted in having more turns in the generator stator for a larger voltage, and this angular velocity
defines how many poles the machine should have in order to minimize the gear ratio. In addition,
depending on the choice of the PMs and on the typical wind distribution, the optimal range may
change.