
Page 328 - Renewable Energy Devices and System with Simulations in MATLAB and ANSYS
P. 328
Power Conversion and Control for Fuel Cell Systems in Transportation 315
Start
Increase Decrease
operating voltage operating voltage
No Is power Yes
Yes Is power No increased?
increased?
FIGURE 12.21 MPPT P&O algorithm flowchart for the fuel cell system used in Figure 12.20.
The algorithm has been coded in the MATLAB S-function block to implement the MPPT con-
®
trol. A sampling time of 2.5 ms has been set with delVin of 0.3 V. In addition to this, the lower and
upper bound of the D has been set to 0.1 as minimum and 0.9 as maximum. These parameters have
been set in the paramBoostMPPT.m.
®
12A.3 Running the Simulink File
• First, run the paramBoostMPPT.m m-file to load the initial parameters.
• Then, check inside the Simulink file BoostMPPTV3_onlyD.mdl if the constant values of
fuel cell model are as per design. In addition to this, set the initial voltage values of input
and output capacitors of boost converter as 30 and 48 V.
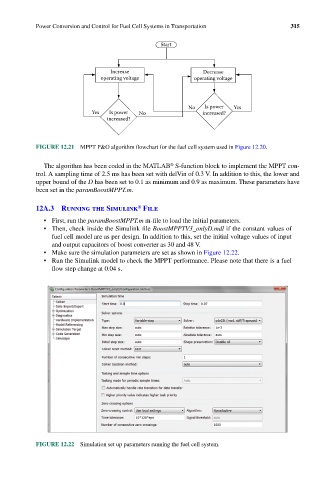
• Make sure the simulation parameters are set as shown in Figure 12.22.
• Run the Simulink model to check the MPPT performance. Please note that there is a fuel
flow step change at 0.04 s.
FIGURE 12.22 Simulation set up parameters running the fuel cell system.