
Page 335 - Renewable Energy Devices and System with Simulations in MATLAB and ANSYS
P. 335
322 Renewable Energy Devices and Systems with Simulations in MATLAB and ANSYS ®
®
TABLE 13.1
Worldwide Installed Electrical Energy Storage Capacity Based on
Fraunhofer Institute Data and Rastler, EPRI, Technical Update, 2010
Energy Storage Technology Installed Capacity (MW)
Pumped hydro 127,000
Compressed air energy storage (CAES) 440
Sodium sulfur battery (NaS) 316
Lead-acid battery 35
Nickel-cadmium battery 27
Flywheels 25
Lithium-ion battery 20
Redox flow battery 3
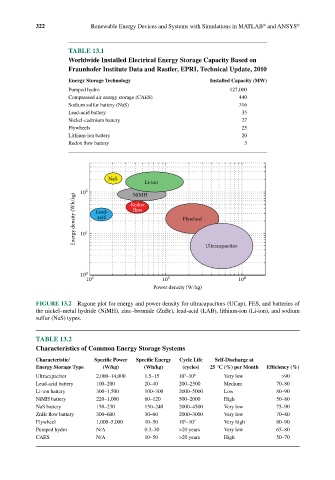
NaS
Li-ion
10 2 Redox
NiMH
Energy density (Wh/kg) 10 1 Lead- flow Flywheel Ultracapacitor
acid
10 0
10 2 10 3 10 4
Power density (W/kg)
FIGURE 13.2 Ragone plot for energy and power density for ultracapacitors (UCap), FES, and batteries of
the nickel–metal hydride (NiMH), zinc–bromide (ZnBr), lead-acid (LAB), lithium-ion (Li-ion), and sodium
sulfur (NaS) types.
TABLE 13.2
Characteristics of Common Energy Storage Systems
Characteristic/ Specific Power Specific Energy Cycle Life Self-Discharge at
Energy Storage Type (W/kg) (Wh/kg) (cycles) 25 °C (%) per Month Efficiency (%)
Ultracapacitor 2,000–14,000 1.5–15 10 –10 6 Very low >90
5
Lead-acid battery 100–200 20–40 200–2500 Medium 70–80
Li-ion battery 300–1,500 100–300 2000–5000 Low 80–90
NiMH battery 220–1,000 60–120 500–2000 High 50–80
NaS battery 150–230 150–240 2000–4500 Very low 75–90
ZnBr flow battery 300–600 30–60 2000–3000 Very low 70–80
Flywheel 1,000–5,000 10–50 10 –10 7 Very high 80–90
5
Pumped hydro N/A 0.3–30 >20 years Very low 65–80
CAES N/A 10–50 >20 years High 50–70