
Page 87 -
P. 87
4.1 Preparing data for statistical analysis 73
after the data is collected. Under those circumstances, you need to remove the
problematic data items and treat them as missing values in the statistical data
analysis.
Sometimes, the data collected need to be cleaned up due to inappropriate format-
ting. Using age as an example, participants may enter age in various formats. In an
online survey, most respondents used numeric values such as “9” to report their age
(Feng et al., 2008). Some used text such as “nine” or “nine and a half.” A number
of participants even entered detailed text descriptions such as “He will turn nine in
January.” The entries in text formats were all transformed to numeric values before
the data was analyzed by statistical software.
4.1.2 CODING DATA
In many studies, the original data collected need to be coded before any statistical
analysis can be conducted. A typical example is the data about the demographic
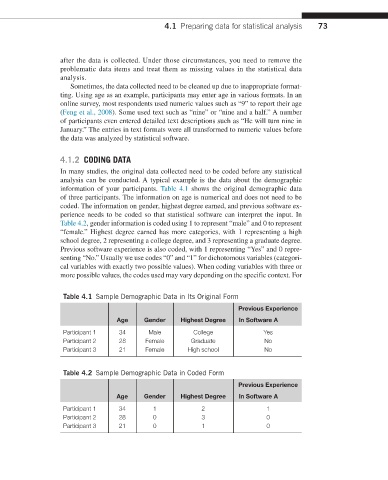
information of your participants. Table 4.1 shows the original demographic data
of three participants. The information on age is numerical and does not need to be
coded. The information on gender, highest degree earned, and previous software ex-
perience needs to be coded so that statistical software can interpret the input. In
Table 4.2, gender information is coded using 1 to represent “male” and 0 to represent
“female.” Highest degree earned has more categories, with 1 representing a high
school degree, 2 representing a college degree, and 3 representing a graduate degree.
Previous software experience is also coded, with 1 representing “Yes” and 0 repre-
senting “No.” Usually we use codes “0” and “1” for dichotomous variables (categori-
cal variables with exactly two possible values). When coding variables with three or
more possible values, the codes used may vary depending on the specific context. For
Table 4.1 Sample Demographic Data in Its Original Form
Previous Experience
Age Gender Highest Degree In Software A
Participant 1 34 Male College Yes
Participant 2 28 Female Graduate No
Participant 3 21 Female High school No
Table 4.2 Sample Demographic Data in Coded Form
Previous Experience
Age Gender Highest Degree In Software A
Participant 1 34 1 2 1
Participant 2 28 0 3 0
Participant 3 21 0 1 0