
Page 89 -
P. 89
4.2 Descriptive statistics 75
The mean is also called the “arithmetic average” of a data set. When multiple
groups are involved in a study, comparing their means can provide preliminary in-
sights on how the groups relate to each other. If you find that the mean of one group
is notably higher than the other group, you may conduct significance tests, such as a
t test, to examine whether that difference is statistically significant. The median is the
middle score in a data set. Consider the following data set of typing speeds collected
from seven users:
{ 15 19 22 29 33 45 50, , , , , , }
The mean of this data set is 30.4 while the median of the data set is 29.
The mode is the value that occurs with the greatest frequency in a data set.
Suppose we collected the following data from seven participants about the number
of hours they spend on the Internet every week:
{ 12 15 22 22 22 34 34, , , , , , }
The mode of the data set is 22.
4.2.2 MEASURES OF SPREAD
Another important group of descriptive measures that we usually want to know is
how much the data points deviate from the center of the data set. In other words, we
want to know how spread out our data set is. Measures in this group include range,
variances, and standard deviations.
The range measures the distance between the highest and lowest scores in the
data set. In the typing-speed data set of Section 4.2.1, the range is 50 − 15 = 35. The
larger the range, the more distributed the data set is.
The variance of a data set is the mean of the squared distances of all the scores
from the mean of the data set. The square root of the variance is called the standard
deviation. As with range, higher variances or standard deviations indicate that the
data set is more distributed.
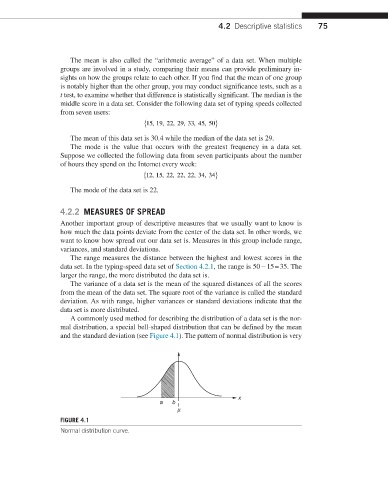
A commonly used method for describing the distribution of a data set is the nor-
mal distribution, a special bell-shaped distribution that can be defined by the mean
and the standard deviation (see Figure 4.1). The pattern of normal distribution is very
x
a b
m
FIGURE 4.1
Normal distribution curve.