
Page 93 -
P. 93
4.4 T tests 79
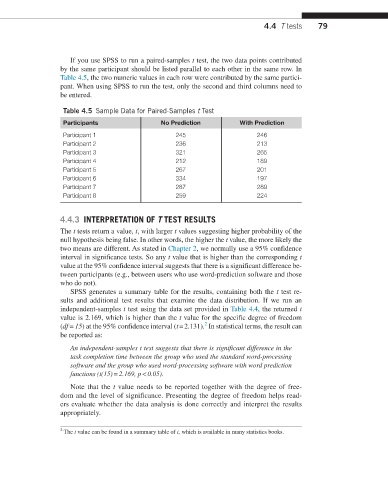
If you use SPSS to run a paired-samples t test, the two data points contributed
by the same participant should be listed parallel to each other in the same row. In
Table 4.5, the two numeric values in each row were contributed by the same partici-
pant. When using SPSS to run the test, only the second and third columns need to
be entered.
Table 4.5 Sample Data for Paired-Samples t Test
Participants No Prediction With Prediction
Participant 1 245 246
Participant 2 236 213
Participant 3 321 265
Participant 4 212 189
Participant 5 267 201
Participant 6 334 197
Participant 7 287 289
Participant 8 259 224
4.4.3 INTERPRETATION OF T TEST RESULTS
The t tests return a value, t, with larger t values suggesting higher probability of the
null hypothesis being false. In other words, the higher the t value, the more likely the
two means are different. As stated in Chapter 2, we normally use a 95% confidence
interval in significance tests. So any t value that is higher than the corresponding t
value at the 95% confidence interval suggests that there is a significant difference be-
tween participants (e.g., between users who use word-prediction software and those
who do not).
SPSS generates a summary table for the results, containing both the t test re-
sults and additional test results that examine the data distribution. If we run an
independent-samples t test using the data set provided in Table 4.4, the returned t
value is 2.169, which is higher than the t value for the specific degree of freedom
2
(df = 15) at the 95% confidence interval (t = 2.131). In statistical terms, the result can
be reported as:
An independent-samples t test suggests that there is significant difference in the
task completion time between the group who used the standard word-processing
software and the group who used word-processing software with word prediction
functions (t(15) = 2.169, p < 0.05).
Note that the t value needs to be reported together with the degree of free-
dom and the level of significance. Presenting the degree of freedom helps read-
ers evaluate whether the data analysis is done correctly and interpret the results
appropriately.
2 The t value can be found in a summary table of t, which is available in many statistics books.