
Page 96 -
P. 96
82 CHAPTER 4 Statistical analysis
2.174 is lower than the value at the 95% confidence interval, suggesting that there
is no significant difference among the three conditions. The results can be reported
as follows:
A one-way ANOVA test using task completion time as the dependent variable and
group as the independent variable suggests that there is no significant difference
among the three conditions (F(2, 21) = 2.174, n.s.).
4.5.2 FACTORIAL ANOVA
Factorial ANOVA is appropriate for empirical studies that adopt a between-group
design and investigate two or more independent variables.
Let us continue with the data-entry evaluation study. You may also want to know
whether different types of task, such as composition or transcription, have any impact
on performance. In this case, you can introduce two independent variables to your study:
data-entry method and task type. There are three conditions for the data-entry method
variable: standard word-processing software, word-prediction software, and speech-
based dictation software. There are two conditions for the task type variable: transcrip-
tion and composition. Accordingly, the empirical study has a total of 3 × 2 = 6 conditions.
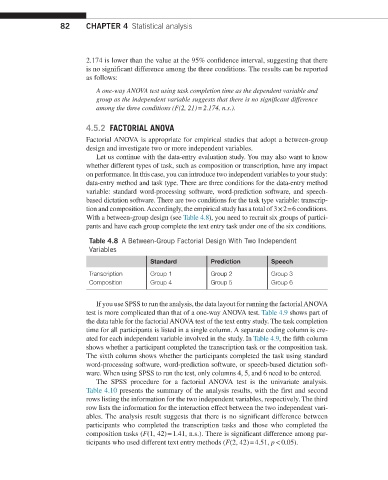
With a between-group design (see Table 4.8), you need to recruit six groups of partici-
pants and have each group complete the text entry task under one of the six conditions.
Table 4.8 A Between-Group Factorial Design With Two Independent
Variables
Standard Prediction Speech
Transcription Group 1 Group 2 Group 3
Composition Group 4 Group 5 Group 6
If you use SPSS to run the analysis, the data layout for running the factorial ANOVA
test is more complicated than that of a one-way ANOVA test. Table 4.9 shows part of
the data table for the factorial ANOVA test of the text entry study. The task completion
time for all participants is listed in a single column. A separate coding column is cre-
ated for each independent variable involved in the study. In Table 4.9, the fifth column
shows whether a participant completed the transcription task or the composition task.
The sixth column shows whether the participants completed the task using standard
word-processing software, word-prediction software, or speech-based dictation soft-
ware. When using SPSS to run the test, only columns 4, 5, and 6 need to be entered.
The SPSS procedure for a factorial ANOVA test is the univariate analysis.
Table 4.10 presents the summary of the analysis results, with the first and second
rows listing the information for the two independent variables, respectively. The third
row lists the information for the interaction effect between the two independent vari-
ables. The analysis result suggests that there is no significant difference between
participants who completed the transcription tasks and those who completed the
composition tasks (F(1, 42) = 1.41, n.s.). There is significant difference among par-
ticipants who used different text entry methods (F(2, 42) = 4.51, p < 0.05).