
Page 101 -
P. 101
4.6 Assumptions of T tests and F tests 87
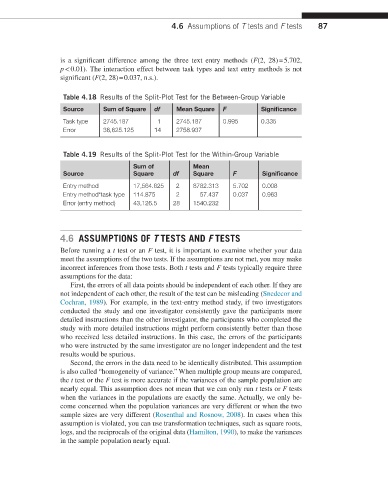
is a significant difference among the three text entry methods (F(2, 28) = 5.702,
p < 0.01). The interaction effect between task types and text entry methods is not
significant (F(2, 28) = 0.037, n.s.).
Table 4.18 Results of the Split-Plot Test for the Between-Group Variable
Source Sum of Square df Mean Square F Significance
Task type 2745.187 1 2745.187 0.995 0.335
Error 38,625.125 14 2758.937
Table 4.19 Results of the Split-Plot Test for the Within-Group Variable
Sum of Mean
Source Square df Square F Significance
Entry method 17,564.625 2 8782.313 5.702 0.008
Entry method*task type 114.875 2 57.437 0.037 0.963
Error (entry method) 43,126.5 28 1540.232
4.6 ASSUMPTIONS OF T TESTS AND F TESTS
Before running a t test or an F test, it is important to examine whether your data
meet the assumptions of the two tests. If the assumptions are not met, you may make
incorrect inferences from those tests. Both t tests and F tests typically require three
assumptions for the data:
First, the errors of all data points should be independent of each other. If they are
not independent of each other, the result of the test can be misleading (Snedecor and
Cochran, 1989). For example, in the text-entry method study, if two investigators
conducted the study and one investigator consistently gave the participants more
detailed instructions than the other investigator, the participants who completed the
study with more detailed instructions might perform consistently better than those
who received less detailed instructions. In this case, the errors of the participants
who were instructed by the same investigator are no longer independent and the test
results would be spurious.
Second, the errors in the data need to be identically distributed. This assumption
is also called “homogeneity of variance.” When multiple group means are compared,
the t test or the F test is more accurate if the variances of the sample population are
nearly equal. This assumption does not mean that we can only run t tests or F tests
when the variances in the populations are exactly the same. Actually, we only be-
come concerned when the population variances are very different or when the two
sample sizes are very different (Rosenthal and Rosnow, 2008). In cases when this
assumption is violated, you can use transformation techniques, such as square roots,
logs, and the reciprocals of the original data (Hamilton, 1990), to make the variances
in the sample population nearly equal.