
Page 106 -
P. 106
92 CHAPTER 4 Statistical analysis
a regression analysis using task completion time as the dependent variable and the
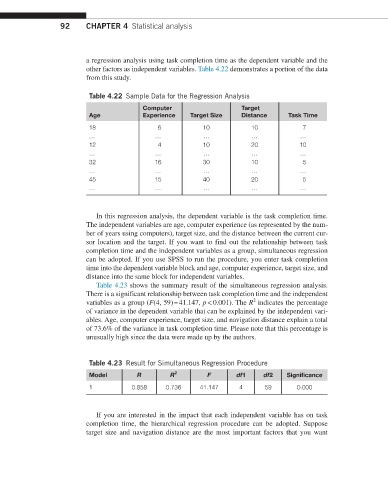
other factors as independent variables. Table 4.22 demonstrates a portion of the data
from this study.
Table 4.22 Sample Data for the Regression Analysis
Computer Target
Age Experience Target Size Distance Task Time
18 6 10 10 7
… … … … …
12 4 10 20 10
… … … … …
32 16 30 10 5
… … … … …
45 15 40 20 5
… … … … …
In this regression analysis, the dependent variable is the task completion time.
The independent variables are age, computer experience (as represented by the num-
ber of years using computers), target size, and the distance between the current cur-
sor location and the target. If you want to find out the relationship between task
completion time and the independent variables as a group, simultaneous regression
can be adopted. If you use SPSS to run the procedure, you enter task completion
time into the dependent variable block and age, computer experience, target size, and
distance into the same block for independent variables.
Table 4.23 shows the summary result of the simultaneous regression analysis.
There is a significant relationship between task completion time and the independent
2
variables as a group (F(4, 59) = 41.147, p < 0.001). The R indicates the percentage
of variance in the dependent variable that can be explained by the independent vari-
ables. Age, computer experience, target size, and navigation distance explain a total
of 73.6% of the variance in task completion time. Please note that this percentage is
unusually high since the data were made up by the authors.
Table 4.23 Result for Simultaneous Regression Procedure
Model R R 2 F df1 df2 Significance
1 0.858 0.736 41.147 4 59 0.000
If you are interested in the impact that each independent variable has on task
completion time, the hierarchical regression procedure can be adopted. Suppose
target size and navigation distance are the most important factors that you want