
Page 102 -
P. 102
88 CHAPTER 4 Statistical analysis
Third, the errors in the data should be normally distributed. Similar to the assump-
tion of “homogeneity of variance,” this assumption is only considered to be violated
when the sample data is highly skewed. When the errors are not normally distributed,
nonparametric tests (discussed in Section 4.8) should be used to analyze the data.
4.7 IDENTIFYING RELATIONSHIPS
One of the most common objectives for HCI-related studies is to identify relationships
between various factors. For example, you may want to know whether there is a rela-
tionship between age, computing experience, and target selection speed. In statistical
terms, two factors are correlated if there is a significant relationship between them.
4.7.1 CORRELATION
The most widely used statistical method for testing correlation is the Pearson's product
moment correlation coefficient test (Rosenthal and Rosnow, 2008). This test returns a
correlation coefficient called Pearson's r. The value of Pearson's r ranges from −1.00 to
1.00. When the Pearson's r value between two variables is −1.00, it suggests a perfect
negative linear relationship between the two variables. In other words, any specific in-
crease in the scores of one variable will perfectly predict a specific amount of decrease
in the scores of the other variable. When the Pearson's r value between two variables is
1.00, it suggests a perfect positive linear relationship between the two variables. That
is, any specific increase in the scores of one variable will perfectly predict a specific
amount of increase in the scores of the other variable. When the Pearson's r value is 0, it
means that there is no linear relationship between the two variables. In other words, the
increase or decrease in one variable does not predict any changes in the other variable.
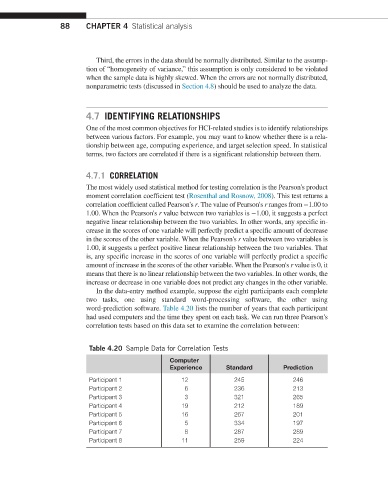
In the data-entry method example, suppose the eight participants each complete
two tasks, one using standard word-processing software, the other using
word- prediction software. Table 4.20 lists the number of years that each participant
had used computers and the time they spent on each task. We can run three Pearson's
correlation tests based on this data set to examine the correlation between:
Table 4.20 Sample Data for Correlation Tests
Computer
Experience Standard Prediction
Participant 1 12 245 246
Participant 2 6 236 213
Participant 3 3 321 265
Participant 4 19 212 189
Participant 5 16 267 201
Participant 6 5 334 197
Participant 7 8 287 289
Participant 8 11 259 224