
Page 100 -
P. 100
86 CHAPTER 4 Statistical analysis
the text entry method is a within-group factor. There are two benefits of this design
as compared to a pure within-group design. First, it greatly reduces the time of the
study and the participants are less likely to feel tired or bored. Second, it controls the
learning effect to some extent. Compared to a pure between-group study, the mixed
design allows you to compare the same number of conditions with a fairly small
sample size.
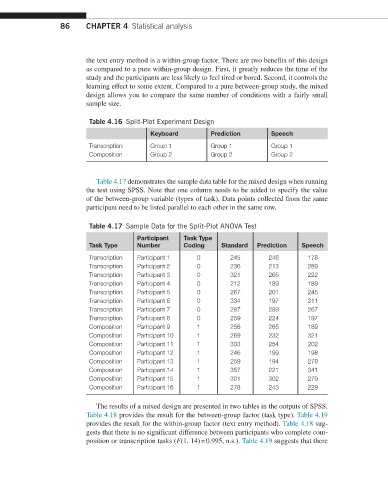
Table 4.16 Split-Plot Experiment Design
Keyboard Prediction Speech
Transcription Group 1 Group 1 Group 1
Composition Group 2 Group 2 Group 2
Table 4.17 demonstrates the sample data table for the mixed design when running
the test using SPSS. Note that one column needs to be added to specify the value
of the between-group variable (types of task). Data points collected from the same
participant need to be listed parallel to each other in the same row.
Table 4.17 Sample Data for the Split-Plot ANOVA Test
Participant Task Type
Task Type Number Coding Standard Prediction Speech
Transcription Participant 1 0 245 246 178
Transcription Participant 2 0 236 213 289
Transcription Participant 3 0 321 265 222
Transcription Participant 4 0 212 189 189
Transcription Participant 5 0 267 201 245
Transcription Participant 6 0 334 197 311
Transcription Participant 7 0 287 289 267
Transcription Participant 8 0 259 224 197
Composition Participant 9 1 256 265 189
Composition Participant 10 1 269 232 321
Composition Participant 11 1 333 254 202
Composition Participant 12 1 246 199 198
Composition Participant 13 1 259 194 278
Composition Participant 14 1 357 221 341
Composition Participant 15 1 301 302 279
Composition Participant 16 1 278 243 229
The results of a mixed design are presented in two tables in the outputs of SPSS.
Table 4.18 provides the result for the between-group factor (task type). Table 4.19
provides the result for the within-group factor (text entry method). Table 4.18 sug-
gests that there is no significant difference between participants who complete com-
position or transcription tasks (F(1, 14) = 0.995, n.s.). Table 4.19 suggests that there