
Page 103 -
P. 103
4.7 Identifying relationships 89
• computer experience and task time under the standard word-processing software
condition;
• computer experience and task time under the prediction software condition; and
• task times under the standard word-processing software condition and those
under the prediction software condition.
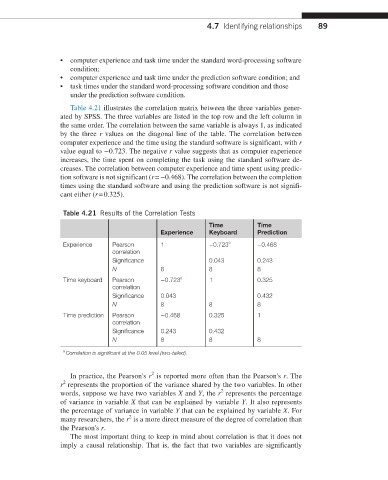
Table 4.21 illustrates the correlation matrix between the three variables gener-
ated by SPSS. The three variables are listed in the top row and the left column in
the same order. The correlation between the same variable is always 1, as indicated
by the three r values on the diagonal line of the table. The correlation between
computer experience and the time using the standard software is significant, with r
value equal to −0.723. The negative r value suggests that as computer experience
increases, the time spent on completing the task using the standard software de-
creases. The correlation between computer experience and time spent using predic-
tion software is not significant (r = −0.468). The correlation between the completion
times using the standard software and using the prediction software is not signifi-
cant either (r = 0.325).
Table 4.21 Results of the Correlation Tests
Time Time
Experience Keyboard Prediction
Experience Pearson 1 −0.723 a −0.468
correlation
Significance 0.043 0.243
N 8 8 8
Time keyboard Pearson −0.723 a 1 0.325
correlation
Significance 0.043 0.432
N 8 8 8
Time prediction Pearson −0.468 0.325 1
correlation
Significance 0.243 0.432
N 8 8 8
a Correlation is significant at the 0.05 level (two-tailed).
2
In practice, the Pearson's r is reported more often than the Pearson's r. The
2
r represents the proportion of the variance shared by the two variables. In other
2
words, suppose we have two variables X and Y, the r represents the percentage
of variance in variable X that can be explained by variable Y. It also represents
the percentage of variance in variable Y that can be explained by variable X. For
2
many researchers, the r is a more direct measure of the degree of correlation than
the Pearson's r.
The most important thing to keep in mind about correlation is that it does not
imply a causal relationship. That is, the fact that two variables are significantly