
Page 108 -
P. 108
94 CHAPTER 4 Statistical analysis
I am satisfied with the time it took to complete the task
1 2 3 4 5
highly disagree disagree neutral agree highly agree
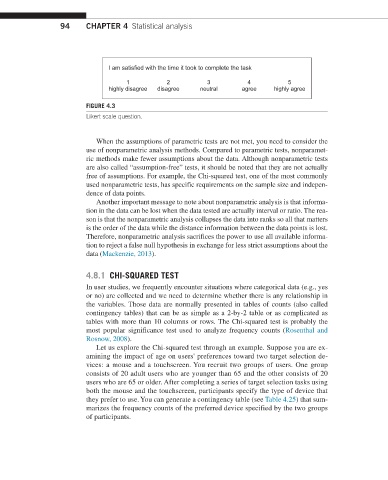
FIGURE 4.3
Likert scale question.
When the assumptions of parametric tests are not met, you need to consider the
use of nonparametric analysis methods. Compared to parametric tests, nonparamet-
ric methods make fewer assumptions about the data. Although nonparametric tests
are also called “assumption-free” tests, it should be noted that they are not actually
free of assumptions. For example, the Chi-squared test, one of the most commonly
used nonparametric tests, has specific requirements on the sample size and indepen-
dence of data points.
Another important message to note about nonparametric analysis is that informa-
tion in the data can be lost when the data tested are actually interval or ratio. The rea-
son is that the nonparametric analysis collapses the data into ranks so all that matters
is the order of the data while the distance information between the data points is lost.
Therefore, nonparametric analysis sacrifices the power to use all available informa-
tion to reject a false null hypothesis in exchange for less strict assumptions about the
data (Mackenzie, 2013).
4.8.1 CHI-SQUARED TEST
In user studies, we frequently encounter situations where categorical data (e.g., yes
or no) are collected and we need to determine whether there is any relationship in
the variables. Those data are normally presented in tables of counts (also called
contingency tables) that can be as simple as a 2-by-2 table or as complicated as
tables with more than 10 columns or rows. The Chi-squared test is probably the
most popular significance test used to analyze frequency counts (Rosenthal and
Rosnow, 2008).
Let us explore the Chi-squared test through an example. Suppose you are ex-
amining the impact of age on users' preferences toward two target selection de-
vices: a mouse and a touchscreen. You recruit two groups of users. One group
consists of 20 adult users who are younger than 65 and the other consists of 20
users who are 65 or older. After completing a series of target selection tasks using
both the mouse and the touchscreen, participants specify the type of device that
they prefer to use. You can generate a contingency table (see Table 4.25) that sum-
marizes the frequency counts of the preferred device specified by the two groups
of participants.