
Page 111 -
P. 111
4.8 Nonparametric statistical tests 97
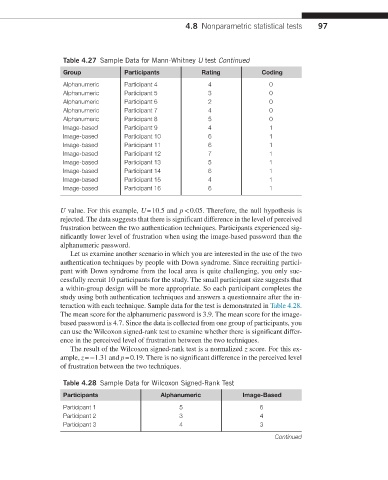
Table 4.27 Sample Data for Mann-Whitney U test Continued
Group Participants Rating Coding
Alphanumeric Participant 4 4 0
Alphanumeric Participant 5 3 0
Alphanumeric Participant 6 2 0
Alphanumeric Participant 7 4 0
Alphanumeric Participant 8 5 0
Image-based Participant 9 4 1
Image-based Participant 10 6 1
Image-based Participant 11 6 1
Image-based Participant 12 7 1
Image-based Participant 13 5 1
Image-based Participant 14 6 1
Image-based Participant 15 4 1
Image-based Participant 16 6 1
U value. For this example, U = 10.5 and p < 0.05. Therefore, the null hypothesis is
rejected. The data suggests that there is significant difference in the level of perceived
frustration between the two authentication techniques. Participants experienced sig-
nificantly lower level of frustration when using the image-based password than the
alphanumeric password.
Let us examine another scenario in which you are interested in the use of the two
authentication techniques by people with Down syndrome. Since recruiting partici-
pant with Down syndrome from the local area is quite challenging, you only suc-
cessfully recruit 10 participants for the study. The small participant size suggests that
a within-group design will be more appropriate. So each participant completes the
study using both authentication techniques and answers a questionnaire after the in-
teraction with each technique. Sample data for the test is demonstrated in Table 4.28.
The mean score for the alphanumeric password is 3.9. The mean score for the image-
based password is 4.7. Since the data is collected from one group of participants, you
can use the Wilcoxon signed-rank test to examine whether there is significant differ-
ence in the perceived level of frustration between the two techniques.
The result of the Wilcoxon signed-rank test is a normalized z score. For this ex-
ample, z = −1.31 and p = 0.19. There is no significant difference in the perceived level
of frustration between the two techniques.
Table 4.28 Sample Data for Wilcoxon Signed-Rank Test
Participants Alphanumeric Image-Based
Participant 1 5 6
Participant 2 3 4
Participant 3 4 3
Continued