
Page 113 -
P. 113
4.8 Nonparametric statistical tests 99
Table 4.29 Sample Data for Kruskal-Wallis One-Way Analysis of Variance by
Ranks Continued
Group Participants Rating Coding
Image-based Participant 12 4 1
Image-based Participant 13 5 1
Image-based Participant 14 4 1
Image-based Participant 15 5 1
Image-based Participant 16 5 1
Drawing-based Participant 17 6 2
Drawing-based Participant 18 4 2
Drawing-based Participant 19 5 2
Drawing-based Participant 20 5 2
Drawing-based Participant 21 6 2
Drawing-based Participant 22 7 2
Drawing-based Participant 23 5 2
Drawing-based Participant 24 7 2
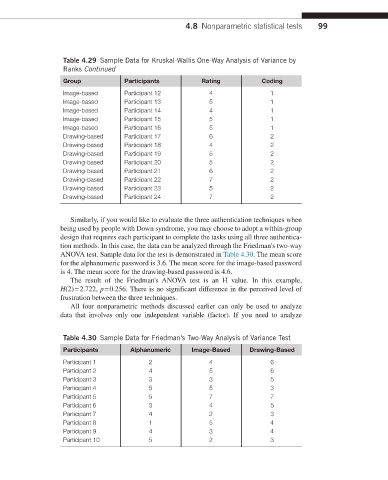
Similarly, if you would like to evaluate the three authentication techniques when
being used by people with Down syndrome, you may choose to adopt a within-group
design that requires each participant to complete the tasks using all three authentica-
tion methods. In this case, the data can be analyzed through the Friedman's two-way
ANOVA test. Sample data for the test is demonstrated in Table 4.30. The mean score
for the alphanumeric password is 3.6. The mean score for the image-based password
is 4. The mean score for the drawing-based password is 4.6.
The result of the Friedman's ANOVA test is an H value. In this example,
H(2) = 2.722, p = 0.256. There is no significant difference in the perceived level of
frustration between the three techniques.
All four nonparametric methods discussed earlier can only be used to analyze
data that involves only one independent variable (factor). If you need to analyze
Table 4.30 Sample Data for Friedman's Two-Way Analysis of Variance Test
Participants Alphanumeric Image-Based Drawing-Based
Participant 1 2 4 6
Participant 2 4 5 6
Participant 3 3 3 5
Participant 4 5 5 3
Participant 5 5 7 7
Participant 6 3 4 5
Participant 7 4 2 3
Participant 8 1 5 4
Participant 9 4 3 4
Participant 10 5 2 3