
Page 109 -
P. 109
4.8 Nonparametric statistical tests 95
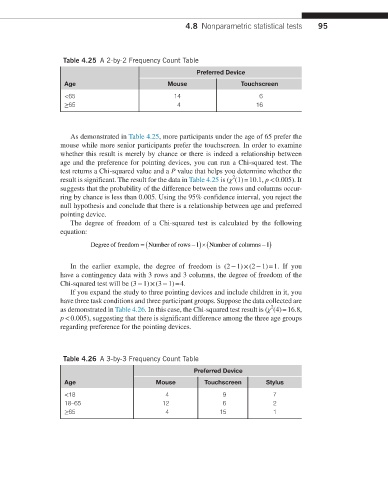
Table 4.25 A 2-by-2 Frequency Count Table
Preferred Device
Age Mouse Touchscreen
<65 14 6
≥65 4 16
As demonstrated in Table 4.25, more participants under the age of 65 prefer the
mouse while more senior participants prefer the touchscreen. In order to examine
whether this result is merely by chance or there is indeed a relationship between
age and the preference for pointing devices, you can run a Chi-squared test. The
test returns a Chi-squared value and a P value that helps you determine whether the
2
result is significant. The result for the data in Table 4.25 is (χ (1) = 10.1, p < 0.005). It
suggests that the probability of the difference between the rows and columns occur-
ring by chance is less than 0.005. Using the 95% confidence interval, you reject the
null hypothesis and conclude that there is a relationship between age and preferred
pointing device.
The degree of freedom of a Chi-squared test is calculated by the following
equation:
Degree of freedom = ( Number of rows - )´( Number of columns - ) 1
1
In the earlier example, the degree of freedom is (2 − 1) × (2 − 1) = 1. If you
have a contingency data with 3 rows and 3 columns, the degree of freedom of the
Chi-squared test will be (3 − 1) × (3 − 1) = 4.
If you expand the study to three pointing devices and include children in it, you
have three task conditions and three participant groups. Suppose the data collected are
2
as demonstrated in Table 4.26. In this case, the Chi-squared test result is (χ (4) = 16.8,
p < 0.005), suggesting that there is significant difference among the three age groups
regarding preference for the pointing devices.
Table 4.26 A 3-by-3 Frequency Count Table
Preferred Device
Age Mouse Touchscreen Stylus
<18 4 9 7
18–65 12 6 2
≥65 4 15 1