
Page 107 -
P. 107
4.8 Nonparametric statistical tests 93
to examine; you can enter target size in the first block for independent variables
and navigation distance, age, and computer experience into the subsequent blocks.
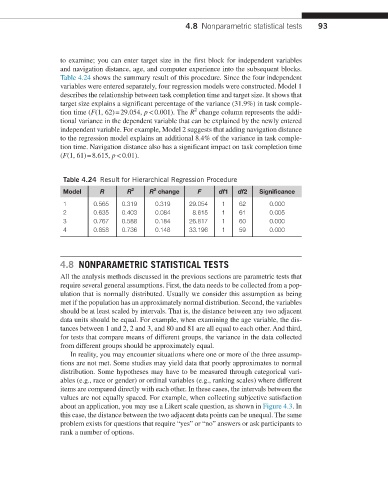
Table 4.24 shows the summary result of this procedure. Since the four independent
variables were entered separately, four regression models were constructed. Model 1
describes the relationship between task completion time and target size. It shows that
target size explains a significant percentage of the variance (31.9%) in task comple-
2
tion time (F(1, 62) = 29.054, p < 0.001). The R change column represents the addi-
tional variance in the dependent variable that can be explained by the newly entered
independent variable. For example, Model 2 suggests that adding navigation distance
to the regression model explains an additional 8.4% of the variance in task comple-
tion time. Navigation distance also has a significant impact on task completion time
(F(1, 61) = 8.615, p < 0.01).
Table 4.24 Result for Hierarchical Regression Procedure
2
Model R R 2 R change F df1 df2 Significance
1 0.565 0.319 0.319 29.054 1 62 0.000
2 0.635 0.403 0.084 8.615 1 61 0.005
3 0.767 0.588 0.184 26.817 1 60 0.000
4 0.858 0.736 0.148 33.196 1 59 0.000
4.8 NONPARAMETRIC STATISTICAL TESTS
All the analysis methods discussed in the previous sections are parametric tests that
require several general assumptions. First, the data needs to be collected from a pop-
ulation that is normally distributed. Usually we consider this assumption as being
met if the population has an approximately normal distribution. Second, the variables
should be at least scaled by intervals. That is, the distance between any two adjacent
data units should be equal. For example, when examining the age variable, the dis-
tances between 1 and 2, 2 and 3, and 80 and 81 are all equal to each other. And third,
for tests that compare means of different groups, the variance in the data collected
from different groups should be approximately equal.
In reality, you may encounter situations where one or more of the three assump-
tions are not met. Some studies may yield data that poorly approximates to normal
distribution. Some hypotheses may have to be measured through categorical vari-
ables (e.g., race or gender) or ordinal variables (e.g., ranking scales) where different
items are compared directly with each other. In these cases, the intervals between the
values are not equally spaced. For example, when collecting subjective satisfaction
about an application, you may use a Likert scale question, as shown in Figure 4.3. In
this case, the distance between the two adjacent data points can be unequal. The same
problem exists for questions that require “yes” or “no” answers or ask participants to
rank a number of options.