
Page 95 -
P. 95
4.5 Analysis of variance 81
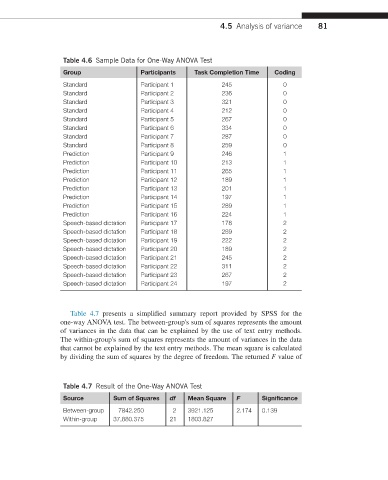
Table 4.6 Sample Data for One-Way ANOVA Test
Group Participants Task Completion Time Coding
Standard Participant 1 245 0
Standard Participant 2 236 0
Standard Participant 3 321 0
Standard Participant 4 212 0
Standard Participant 5 267 0
Standard Participant 6 334 0
Standard Participant 7 287 0
Standard Participant 8 259 0
Prediction Participant 9 246 1
Prediction Participant 10 213 1
Prediction Participant 11 265 1
Prediction Participant 12 189 1
Prediction Participant 13 201 1
Prediction Participant 14 197 1
Prediction Participant 15 289 1
Prediction Participant 16 224 1
Speech-based dictation Participant 17 178 2
Speech-based dictation Participant 18 289 2
Speech-based dictation Participant 19 222 2
Speech-based dictation Participant 20 189 2
Speech-based dictation Participant 21 245 2
Speech-based dictation Participant 22 311 2
Speech-based dictation Participant 23 267 2
Speech-based dictation Participant 24 197 2
Table 4.7 presents a simplified summary report provided by SPSS for the
one-way ANOVA test. The between-group's sum of squares represents the amount
of variances in the data that can be explained by the use of text entry methods.
The within-group's sum of squares represents the amount of variances in the data
that cannot be explained by the text entry methods. The mean square is calculated
by dividing the sum of squares by the degree of freedom. The returned F value of
Table 4.7 Result of the One-Way ANOVA Test
Source Sum of Squares df Mean Square F Significance
Between-group 7842.250 2 3921.125 2.174 0.139
Within-group 37,880.375 21 1803.827