
Page 92 -
P. 92
78 CHAPTER 4 Statistical analysis
4.4.1 INDEPENDENT-SAMPLES T TEST
You can test the hypothesis by recruiting two groups of participants and have one
group type some text using standard word-processing software only and another
group using the word-processing software with word-prediction functions. If a
random-sampling method is used, the two groups are presumably independent
from each other. In this case, the independent-samples t test is appropriate for data
analysis.
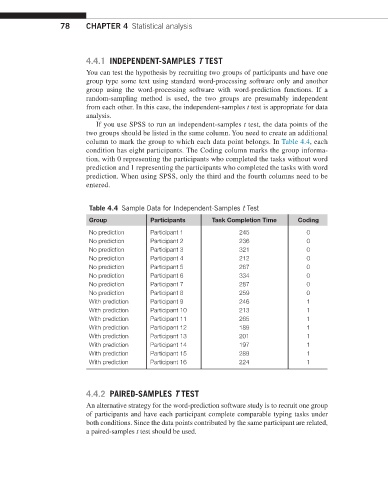
If you use SPSS to run an independent-samples t test, the data points of the
two groups should be listed in the same column. You need to create an additional
column to mark the group to which each data point belongs. In Table 4.4, each
condition has eight participants. The Coding column marks the group informa-
tion, with 0 representing the participants who completed the tasks without word
prediction and 1 representing the participants who completed the tasks with word
prediction. When using SPSS, only the third and the fourth columns need to be
entered.
Table 4.4 Sample Data for Independent-Samples t Test
Group Participants Task Completion Time Coding
No prediction Participant 1 245 0
No prediction Participant 2 236 0
No prediction Participant 3 321 0
No prediction Participant 4 212 0
No prediction Participant 5 267 0
No prediction Participant 6 334 0
No prediction Participant 7 287 0
No prediction Participant 8 259 0
With prediction Participant 9 246 1
With prediction Participant 10 213 1
With prediction Participant 11 265 1
With prediction Participant 12 189 1
With prediction Participant 13 201 1
With prediction Participant 14 197 1
With prediction Participant 15 289 1
With prediction Participant 16 224 1
4.4.2 PAIRED-SAMPLES T TEST
An alternative strategy for the word-prediction software study is to recruit one group
of participants and have each participant complete comparable typing tasks under
both conditions. Since the data points contributed by the same participant are related,
a paired-samples t test should be used.