
Page 139 - Reservoir Formation Damage
P. 139
Characterization of Reservoir Rock 121
150 ' F Wettability Curve
250 • F Wettability Curve
20 30 40 50
AVERAGE WATER SATURATION, %
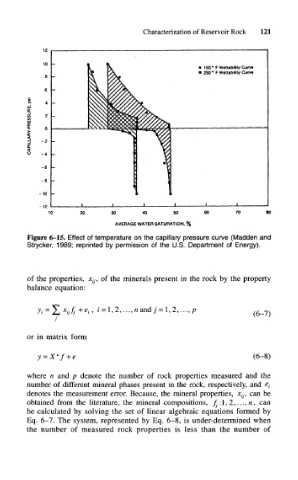
Figure 6-15. Effect of temperature on the capillary pressure curve (Madden and
Strycker, 1989; reprinted by permission of the U.S. Department of Energy).
of the properties, x tj, of the minerals present in the rock by the property
balance equation:
(6-7)
or in matrix form
(6-8)
where n and p denote the number of rock properties measured and the
number of different mineral phases present in the rock, respectively, and £,
denotes the measurement error. Because, the mineral properties, x tj, can be
obtained from the literature, the mineral compositions, ^:1,2,...,«, can
be calculated by solving the set of linear algebraic equations formed by
Eq. 6-7. The system, represented by Eq. 6-8, is under-determined when
the number of measured rock properties is less than the number of