
Page 137 - Reservoir Formation Damage
P. 137
Characterization of Reservoir Rock 119
Electrophoresis
Streaming Potential
C
0) -40-
O
0.
-60-
10" 10 V
Ionic Strength [M]
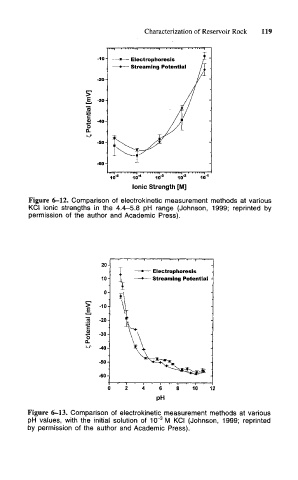
Figure 6-12. Comparison of electrokinetic measurement methods at various
KCI ionic strengths in the 4.4-5.8 pH range (Johnson, 1999; reprinted by
permission of the author and Academic Press).
20- .
I — • — Electrophoresis
10- I — * — Streaming Potential -
I
0-
I\
> -10-
I—J 1 :
Is -20- I
1 -30- V
o
Q. \\
\\
^ -40-
^V-i—.
a
M:
-50- ^* *v" ,
~-^^
-60- — *^^ _
C 2 4 6 8 10 1:
PH
Figure 6-13. Comparison of electrokinetic measurement methods at various
3
pH values, with the initial solution of 1(T M KCI (Johnson, 1999; reprinted
by permission of the author and Academic Press).