
Page 272 - Reservoir Formation Damage
P. 272
252 Reservoir Formation Damage
Table 11-1
Core Test Data for Fines Migrations*
Data Core without ROS Core with ROS
Core diameter (cm) 2.54 2.54
Core length (cm) 8.30 8.30
Initial porosity (fraction) 0.21 0.21
Initial permeability (Darcy) 0.0654 0.0825
Residual oil saturation 0.0 0.367
End-point relative permeability 1.0 0.038
Injection velocity (cm/s) 4.31 x 10" 4 4.31X10" 4
Water viscosity (cp) 1.0 1.0
* Information extracted from Sarkar and Sharma, 1990. After Liu and Civan, ©1996 SPE; reprinted by
permission of the Society of Petroleum Engineers.
Table 11-2
Model Parameters for Fines Migrations*
Parameter Core without ROS Core with ROS
3
(gm/cm ) 0.025 0.02
<5 fpo
C sc (mole/liter) 7.0 x 10~ 3 7.0 x 10~ 3
k s 0.435 0.28
crjp,w ( ' liter/mole)
l
k hrfpw(cm~ ) 0.0 0.0
1
k pt/pw (cm" ) 5.25 5.25
3
k fetfp (cm /gm) 35.4 35.4
.
•J f mm 0.0 0.0
k 0.0 0.0
P
* After Liu and Civan, ©1996 SPE; reprinted by permission of the Society of Petroleum Engineers.
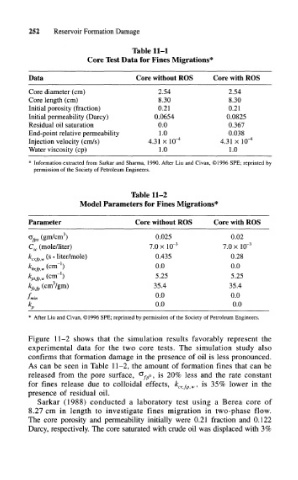
Figure 11-2 shows that the simulation results favorably represent the
experimental data for the two core tests. The simulation study also
confirms that formation damage in the presence of oil is less pronounced.
As can be seen in Table 11-2, the amount of formation fines that can be
released from the pore surface, °/ p°, is 20% less and the rate constant
for fines release due to colloidal effects, k cr<fptW, is 35% lower in the
presence of residual oil.
Sarkar (1988) conducted a laboratory test using a Berea core of
8.27 cm in length to investigate fines migration in two-phase flow.
The core porosity and permeability initially were 0.21 fraction and 0.122
Darcy, respectively. The core saturated with crude oil was displaced with 3%