
Page 49 - Reservoir Formation Damage
P. 49
Mineralogy and Mineral Sensitivity of Petroleum-Bearing Formations 33
10 15
1
1 « (hr
• Osisanya and Chenevert Gage 1 data
Correlation of the Gage 1 data
% Osisanya and Chenevert Gage 2 data
Correlation of the Gage 2 data
X Osisanya and Chenevert Gage 3 data
Correlation of the Gage 3 data
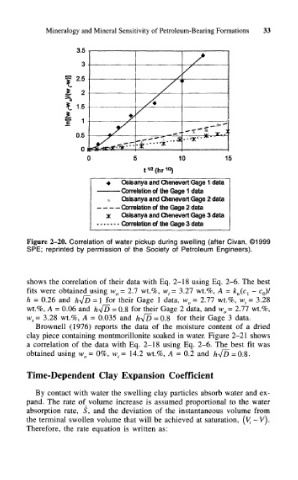
Figure 2-20. Correlation of water pickup during swelling (after Civan, ©1999
SPE; reprinted by permission of the Society of Petroleum Engineers).
shows the correlation of their data with Eq. 2-18 using Eq. 2-6. The best
fits were obtained using w 0= 2.7 wt.%, w t= 3.27 wt.%, A = k w(c { - c 0)/
h = 0.26 and h-Jo = \ for their Gage 1 data, w 0 = 2.77 wt.%, w t = 3.28
wt.%, A = 0.06 and h^D = 0.8 for their Gage 2 data, and w 0= 2.77 wt.%,
w t = 3.28 wt.%, A = 0.035 and h-^j~D = 0.8 for their Gage 3 data.
Brownell (1976) reports the data of the moisture content of a dried
clay piece containing montmorillonite soaked in water. Figure 2-21 shows
a correlation of the data with Eq. 2-18 using Eq. 2-6. The best fit was
obtained using w 0 = 0%, w t = 14.2 wt.%, A = 0.2 and
Time-Dependent Clay Expansion Coefficient
By contact with water the swelling clay particles absorb water and ex-
pand. The rate of volume increase is assumed proportional to the water
absorption rate, 5, and the deviation of the instantaneous volume from
the terminal swollen volume that will be achieved at saturation, (V t - V).
Therefore, the rate equation is written as: