Page 51 - Reservoir Formation Damage
P. 51

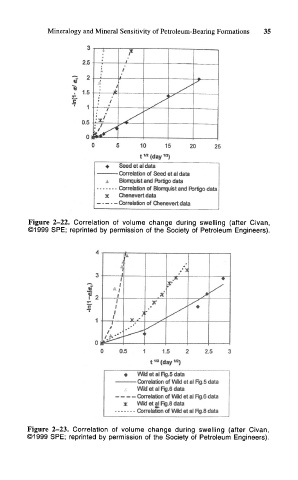
Mineralogy  and Mineral  Sensitivity of Petroleum-Bearing  Formations  35


                                 :     F
                           25          i
                                !     i
                             2 .     f
                                                         S
                               .,&  f
                                                     /-
                           1 *i     t
                                                  4 \s^
                                •  I
                             •J  .
                                  1         \S^
                               ;*/
                           0 5
                               \/S+
                            n >£#     ^
                            U I
                              C      5     10     15    20     2f
                                                  1
                                           t  ira  (day «)
                                  +  Seed et al data
                                     Correlation of Seed et al data
                                  A  Bfomqutet and Fbrtigo data
                                     Correlation of  Btomquist and Portigo data
                                  X  Chenevert data
                                     Correlation of Chenevert data
             Figure  2-22.  Correlation  of  volume  change  during  swelling  (after  Civan,
             ©1999 SPE; reprinted by  permission  of  the  Society  of  Petroleum  Engineers).


                                     k
                                    i.
                                                    •*>

                                   1            y          /
                                   1          X
                                            y         ^»
                                  1             /
                             •\          ^
                                 1
                                          /
                                    ^<
                             0  ,
                              0    0.5    1    1.5   2    2.5   3
                                                  in
                                            t 1/2 (day )
                                     •  Wil d et al Fig.5 data
                                        CYi rrelation of Wild et al Fig.5 data
                                     .>,  Wild et al Fig.6 data
                                        Co-relation of Wad et al Rg.6 data
                                     X  W8d et al Rg.8 data
                                        fV, •relation of Wild et al Fig.8 data
             Figure  2-23.  Correlation  of  volume  change  during  swelling  (after  Civan,
             ©1999  SPE; reprinted by  permission  of  the  Society of  Petroleum  Engineers).
   46   47   48   49   50   51   52   53   54   55   56