
Page 56 - Reservoir Formation Damage
P. 56
40 Reservoir Formation Damage
1.2
Ngwenyaetaldata
1
Correlation of
Ngwenyaetaldata
? 0.8 Linear (Ngwenyaet
al data)
£f 0.6
0.4
0.2
0
10 20 30
t i*(hr 1/2 )
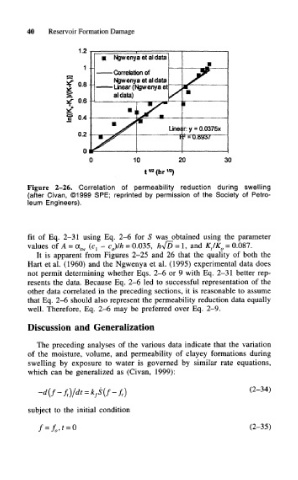
Figure 2-26. Correlation of permeability reduction during swelling
(after Civan, ©1999 SPE; reprinted by permission of the Society of Petro-
leum Engineers).
fit of Eq. 2-31 using Eq. 2-6 for 5 was obtained using the parameter
values of A = a sw (c l - c 0)/h = 0.035, hjD = 1, and K tIK 0 = 0.087.
It is apparent from Figures 2-25 and 26 that the quality of both the
Hart et al. (1960) and the Ngwenya et al. (1995) experimental data does
not permit determining whether Eqs. 2-6 or 9 with Eq. 2-31 better rep-
resents the data. Because Eq. 2-6 led to successful representation of the
other data correlated in the preceding sections, it is reasonable to assume
that Eq. 2-6 should also represent the permeability reduction data equally
well. Therefore, Eq. 2-6 may be preferred over Eq. 2-9.
Discussion and Generalization
The preceding analyses of the various data indicate that the variation
of the moisture, volume, and permeability of clayey formations during
swelling by exposure to water is governed by similar rate equations,
which can be generalized as (Civan, 1999):
(2-34)
-d(f-f t)/dt = k fS(f-f t)
subject to the initial condition
(2-35)