
Page 55 - Reservoir Formation Damage
P. 55
Mineralogy and Mineral Sensitivity of Petroleum-Bearing Formations 39
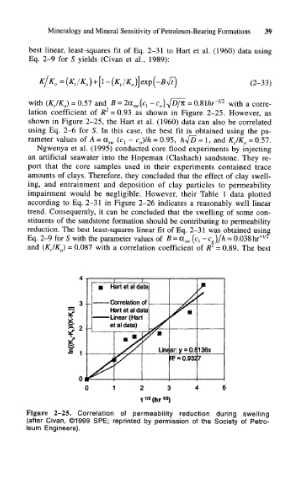
best linear, least-squares fit of Eq. 2-31 to Hart et al. (1960) data using
Eq. 2-9 for S yields (Civan et al., 1989):
(2-33)
with (K t/K 0) = 0.57 and B = 2a sw(c l -c 0)Jo/n = QMhr~ {/2 with a corre-
2
lation coefficient of R = 0.93 as shown in Figure 2-25. However, as
shown in Figure 2-25, the Hart et al. (1960) data can also be correlated
using Eq. 2-6 for S. In this case, the best fit is obtained using the pa-
rameter values of A = a sw (q - c 0)/h = 0.95, h^D = 1, and K t/K 0 = 0.57.
Ngwenya et al. (1995) conducted core flood experiments by injecting
an artificial seawater into the Hopeman (Clashach) sandstone. They re-
port that the core samples used in their experiments contained trace
amounts of clays. Therefore, they concluded that the effect of clay swell-
ing, and entrainment and deposition of clay particles to permeability
impairment would be negligible. However, their Table 1 data plotted
according to Eq. 2-31 in Figure 2-26 indicates a reasonably well linear
trend. Consequently, it can be concluded that the swelling of some con-
stituents of the sandstone formation should be contributing to permeability
reduction. The best least-squares linear fit of Eq. 2-31 was obtained using
Eq. 2-9 for 5 with the parameter values of B = a sw (c, - c 0)/h = 0.038hr~ 1/2
2
and (K tIK 0} = 0.087 with a correlation coefficient of R = 0.89. The best
• Hart etal data
3 - • Correlation of
Hart et al data
•Linear (Hart
et al data)
Figure 2-25. Correlation of permeability reduction during swelling
(after Civan, ©1999 SPE; reprinted by permission of the Society of Petro-
leum Engineers).