
Page 145 - Reservoir Geomechanics
P. 145
128 Reservoir geomechanics
S - S (MPa)
3
1
0 100 200 300 400
0
o
Temp. C
STRESS ORIENTATION 50
2
100
DIFFERENTIAL
4
STRESS MAGNITUDES
( 0.6 < m < 0.7 )
150
6
Depth (km) 200
8
250
N130°E (±10°)
10 0 10 20 30
Number of 300
Induced earthquakes BRITTLE– DUCTILE
TRANSITION?
12
350
14
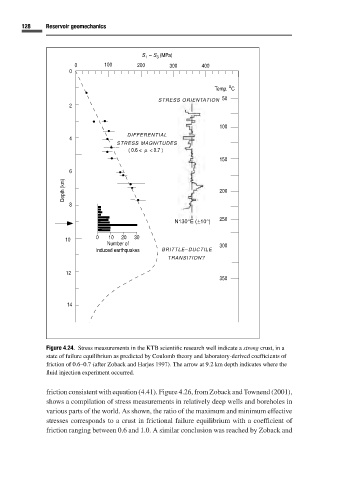
Figure 4.24. Stress measurements in the KTB scientific research well indicate a strong crust, in a
state of failure equilibrium as predicted by Coulomb theory and laboratory-derived coefficients of
friction of 0.6–0.7 (after Zoback and Harjes 1997). The arrow at 9.2 km depth indicates where the
fluid injection experiment occurred.
friction consistent with equation (4.41). Figure 4.26, from Zoback and Townend (2001),
shows a compilation of stress measurements in relatively deep wells and boreholes in
various parts of the world. As shown, the ratio of the maximum and minimum effective
stresses corresponds to a crust in frictional failure equilibrium with a coefficient of
friction ranging between 0.6 and 1.0. A similar conclusion was reached by Zoback and