
Page 148 - Reservoir Geomechanics
P. 148
131 Rock failure in compression, tension and shear
a. b.
S 1
b
S 1 2
S 1 1 3
c.
t
m = 0.6
b = 60 o m
1
2
2b
3
S 0 s 3 s 1 s n
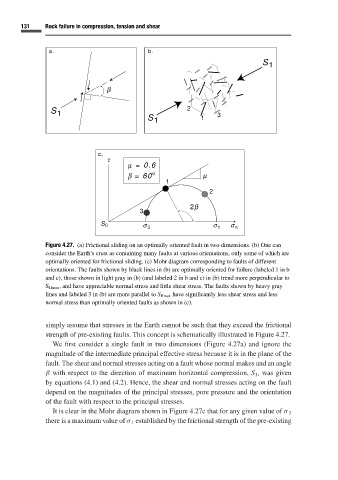
Figure 4.27. (a) Frictional sliding on an optimally oriented fault in two dimensions. (b) One can
consider the Earth’s crust as containing many faults at various orientations, only some of which are
optimally oriented for frictional sliding. (c) Mohr diagram corresponding to faults of different
orientations. The faults shown by black lines in (b) are optimally oriented for failure (labeled 1 in b
and c), those shown in light gray in (b) (and labeled 2 in b and c) in (b) trend more perpendicular to
S Hmax , and have appreciable normal stress and little shear stress. The faults shown by heavy gray
lines and labeled 3 in (b) are more parallel to S Hmax have significantly less shear stress and less
normal stress than optimally oriented faults as shown in (c).
simply assume that stresses in the Earth cannot be such that they exceed the frictional
strength of pre-existing faults. This concept is schematically illustrated in Figure 4.27.
We first consider a single fault in two dimensions (Figure 4.27a) and ignore the
magnitude of the intermediate principal effective stress because it is in the plane of the
fault. The shear and normal stresses acting on a fault whose normal makes and an angle
β with respect to the direction of maximum horizontal compression, S 1 ,was given
by equations (4.1) and (4.2). Hence, the shear and normal stresses acting on the fault
depend on the magnitudes of the principal stresses, pore pressure and the orientation
of the fault with respect to the principal stresses.
It is clear in the Mohr diagram shown in Figure 4.27c that for any given value of σ 3
there is a maximum value of σ 1 established by the frictional strength of the pre-existing