
Page 146 - Reservoir Geomechanics
P. 146
x
x x x x
x
x
x x
x x
x x x Plate-driving
x
Brittle seismogenic zone t = m (S n - Pp) x forces −1
12
16 km ~3 x 10 N m
Ductile lower crust
Moho 40 km
Ductile upper mantle
n
e = A exp(−Q/RT ) ∆S ductile
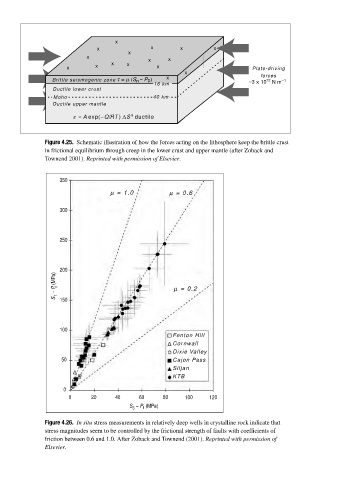
Figure 4.25. Schematic illustration of how the forces acting on the lithosphere keep the brittle crust
in frictional equilibrium through creep in the lower crust and upper mantle (after Zoback and
Townend 2001). Reprinted with permission of Elsevier.
350
m = 1.0 m = 0.6
300
250
200
S 1 − P f (MPa) 150 m = 0.2
100
Fenton Hill
Cornwall
Dixie Valley
50 Cajon Pass
Siljan
KTB
0
0 20 40 60 80 100 120
S − P (MPa)
3 f
Figure 4.26. In situ stress measurements in relatively deep wells in crystalline rock indicate that
stress magnitudes seem to be controlled by the frictional strength of faults with coefficients of
friction between 0.6 and 1.0. After Zoback and Townend (2001). Reprinted with permission of
Elsevier.