
Page 154 - Reservoir Geomechanics
P. 154
137 Rock failure in compression, tension and shear
(in accord with equations 4.45, 4.46 and 4.47)as pore pressure changes (as illustrated).
But this is not true of the ratios (or differences) in the absolute stress magnitudes (as
shown in Figure 4.29) such that the higher the pore pressure, the lower the principal
stress differences. At extremely high pore pressure, relatively small stress perturbations
are sufficient to change the style of faulting from one stress regime to the other (for
example, to go from normal faulting to reverse faulting). This is dramatically different
from the case in which pore pressure is hydrostatic. The second point to note is that
perturbations of pore pressure associated with depletion (or injection) will also affect
stress magnitudes through the types of poroelastic effects discussed in Chapter 3. Hence,
the size and position of the Mohr circle is affected by the change in pore pressure. This
can have an important influence on reservoir behavior, especially in normal faulting
regions (Chapter 12).
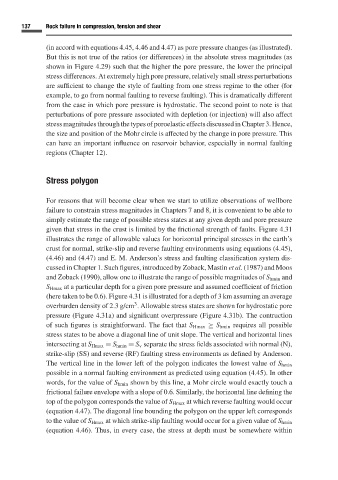
Stress polygon
For reasons that will become clear when we start to utilize observations of wellbore
failure to constrain stress magnitudes in Chapters 7 and 8,itis convenient to be able to
simply estimate the range of possible stress states at any given depth and pore pressure
given that stress in the crust is limited by the frictional strength of faults. Figure 4.31
illustrates the range of allowable values for horizontal principal stresses in the earth’s
crust for normal, strike-slip and reverse faulting environments using equations (4.45),
(4.46) and (4.47) and E. M. Anderson’s stress and faulting classification system dis-
cussed in Chapter 1. Such figures, introduced by Zoback, Mastin et al.(1987) and Moos
and Zoback (1990), allow one to illustrate the range of possible magnitudes of S hmin and
S Hmax at a particular depth for a given pore pressure and assumed coefficient of friction
(here taken to be 0.6). Figure 4.31 is illustrated for a depth of 3 km assuming an average
3
overburden density of 2.3 g/cm . Allowable stress states are shown for hydrostatic pore
pressure (Figure 4.31a) and significant overpressure (Figure 4.31b). The contruction
of such figures is straightforward. The fact that S Hmax ≥ S hmin requires all possible
stress states to be above a diagonal line of unit slope. The vertical and horizontal lines
intersecting at S Hmax = S hmin = S v separate the stress fields associated with normal (N),
strike-slip (SS) and reverse (RF) faulting stress environments as defined by Anderson.
The vertical line in the lower left of the polygon indicates the lowest value of S hmin
possible in a normal faulting environment as predicted using equation (4.45). In other
words, for the value of S hmin shown by this line, a Mohr circle would exactly touch a
frictional failure envelope with a slope of 0.6. Similarly, the horizontal line defining the
top of the polygon corresponds the value of S Hmax at which reverse faulting would occur
(equation 4.47). The diagonal line bounding the polygon on the upper left corresponds
to the value of S Hmax at which strike-slip faulting would occur for a given value of S hmin
(equation 4.46). Thus, in every case, the stress at depth must be somewhere within