
Page 155 - Reservoir Geomechanics
P. 155
138 Reservoir geomechanics
a.
HYDROSTATIC PORE PRESSURE
3
REVERSE 3)
FAULTING
S Hmax 2 SS 2) s v s Hmax
S s s s
NF v hmin v Hmax
1 1)
s hmin s v
70 MPa S hmin
(~3 km depth)
b.
HYDROSTATIC PORE PRESSURE
S Hmax
S HIGH PORE PRESSURE
v
70 MPa S hmin
(~3 km depth)
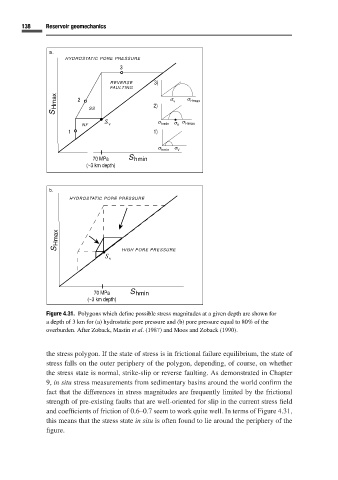
Figure 4.31. Polygons which define possible stress magnitudes at a given depth are shown for
a depth of 3 km for (a) hydrostatic pore pressure and (b) pore pressure equal to 80% of the
overburden. After Zoback, Mastin et al.(1987) and Moos and Zoback (1990).
the stress polygon. If the state of stress is in frictional failure equilibrium, the state of
stress falls on the outer periphery of the polygon, depending, of course, on whether
the stress state is normal, strike-slip or reverse faulting. As demonstrated in Chapter
9, in situ stress measurements from sedimentary basins around the world confirm the
fact that the differences in stress magnitudes are frequently limited by the frictional
strength of pre-existing faults that are well-oriented for slip in the current stress field
and coefficients of friction of 0.6–0.7 seem to work quite well. In terms of Figure 4.31,
this means that the stress state in situ is often found to lie around the periphery of the
figure.