
Page 243 - Reservoir Geomechanics
P. 243
224 Reservoir geomechanics
a. b.
100
150
125 80
100
60
75
40
50
20
25
0 0
0 45 90 135 180 0 30 60 90
Breakout azimuths Breakout widths
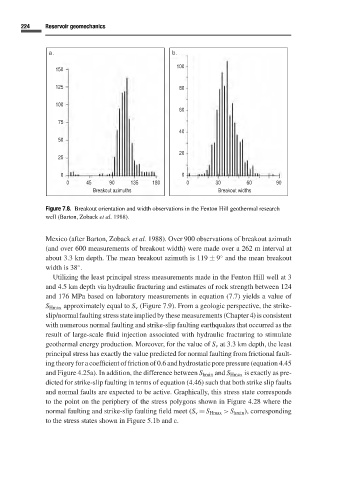
Figure 7.8. Breakout orientation and width observations in the Fenton Hill geothermal research
well (Barton, Zoback et al. 1988).
Mexico (after Barton, Zoback et al. 1988). Over 900 observations of breakout azimuth
(and over 600 measurements of breakout width) were made over a 262 m interval at
about 3.3 km depth. The mean breakout azimuth is 119 ± 9 and the mean breakout
◦
width is 38 .
◦
Utilizing the least principal stress measurements made in the Fenton Hill well at 3
and 4.5 km depth via hydraulic fracturing and estimates of rock strength between 124
and 176 MPa based on laboratory measurements in equation (7.7) yields a value of
S Hmax approximately equal to S v (Figure 7.9). From a geologic perspective, the strike-
slip/normal faulting stress state implied by these measurements (Chapter 4)is consistent
with numerous normal faulting and strike-slip faulting earthquakes that occurred as the
result of large-scale fluid injection associated with hydraulic fracturing to stimulate
geothermal energy production. Moreover, for the value of S v at 3.3 km depth, the least
principal stress has exactly the value predicted for normal faulting from frictional fault-
ing theory for a coefficient of friction of 0.6 and hydrostatic pore pressure (equation 4.45
and Figure 4.25a). In addition, the difference between S hmin and S Hmax is exactly as pre-
dicted for strike-slip faulting in terms of equation (4.46) such that both strike slip faults
and normal faults are expected to be active. Graphically, this stress state corresponds
to the point on the periphery of the stress polygons shown in Figure 4.28 where the
normal faulting and strike-slip faulting field meet (S v = S Hmax > S hmin ), corresponding
to the stress states shown in Figure 5.1b and c.