
Page 271 - Reservoir Geomechanics
P. 271
252 Reservoir geomechanics
a.
180
b.
S Hmax 160
Hmax
Azimuth of 120
140
100
40 41 42
S Hmax (MPa)
24 31
Critical strength (MPa)
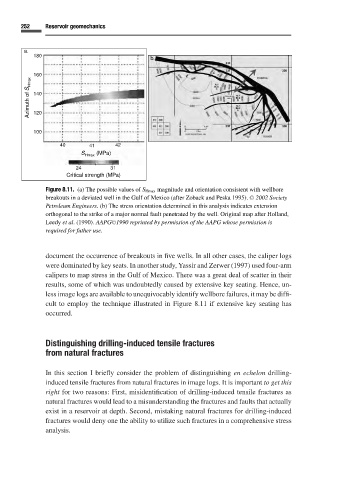
Figure 8.11. (a) The possible values of S Hmax magnitude and orientation consistent with wellbore
breakouts in a deviated well in the Gulf of Mexico (after Zoback and Peska 1995). C 2002 Society
Petroleum Engineers. (b) The stress orientation determined in this analysis indicates extension
orthogonal to the strike of a major normal fault penetrated by the well. Original map after Holland,
Leedy et al.(1990). AAPG C 1990 reprinted by permission of the AAPG whose permission is
required for futher use.
document the occurrence of breakouts in five wells. In all other cases, the caliper logs
were dominated by key seats. In another study, Yassir and Zerwer (1997) used four-arm
calipers to map stress in the Gulf of Mexico. There was a great deal of scatter in their
results, some of which was undoubtedly caused by extensive key seating. Hence, un-
less image logs are available to unequivocably identify wellbore failures, it may be diffi-
cult to employ the technique illustrated in Figure 8.11 if extensive key seating has
occurred.
Distinguishing drilling-induced tensile fractures
from natural fractures
In this section I briefly consider the problem of distinguishing en echelon drilling-
induced tensile fractures from natural fractures in image logs. It is important to get this
right for two reasons: First, misidentification of drilling-induced tensile fractures as
natural fractures would lead to a misunderstanding the fractures and faults that actually
exist in a reservoir at depth. Second, mistaking natural fractures for drilling-induced
fractures would deny one the ability to utilize such fractures in a comprehensive stress
analysis.